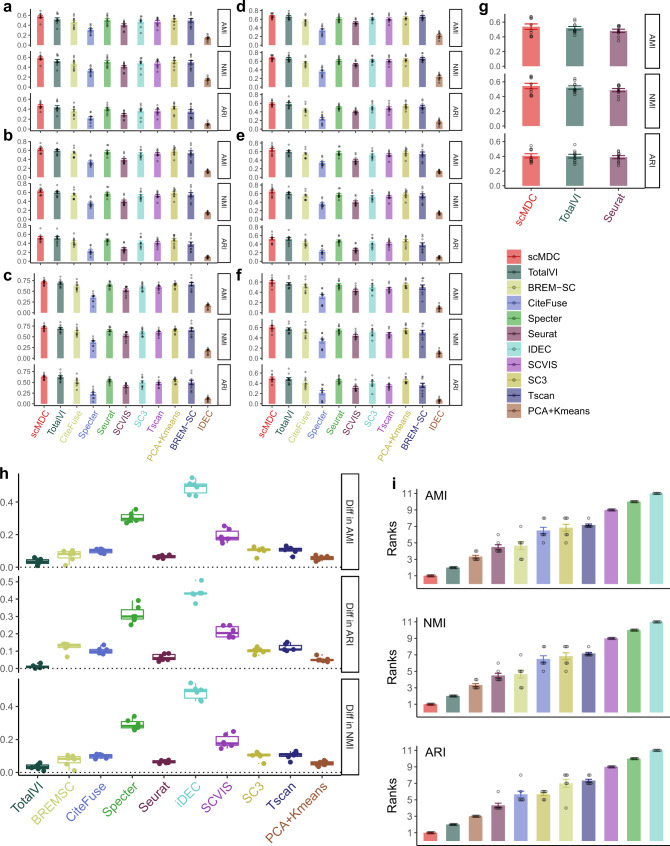
Fig. 4. Clustering performance of scMDC and the competing methods on the simulation datasets.
The first simulation experiment is to test the clustering performance of scMDC with low (a), medium (b), and high (c) clustering signals. The second simulation experiment is to test the clustering performance of scMDC with low (d), medium (e), and high (f) dropout rates. Since scMDC, Seurat, and TotalVI can correct the batch effect, we also test their clustering performance on a multi-batch simulation dataset (g). In panels (a–f), bars stand for the mean values, dots stand for the data points, and error bars stand for the standard errors. We generate ten replicates for each experimental setting (n = 10). The differences between the averaged performance of scMDC and the competing methods over all simulation datasets are shown in boxplots (h, n = 6). Each boxplot shows the minimum, first quartile (Q1), median, third quartile (Q3), and maximum of data. The minimum and maximum are the smallest data point that is equal to or greater than Q1 − 1.5 * IQR and the largest data point that is equal to or less than Q3 + 1.5 * IQR, respectively. Each data point (a difference of averaged performance in a dataset) is shown by a dot. We also summarized the performance of each method by showing the averaged ranks (i, n = 7). Each data point (an average rank of a method in a setting) is shown by a dot and the standard errors are shown by the error bars. In all panels, the clustering performance is evaluated by AMI, NMI, and ARI. Source data is provided as a Source Data file.

