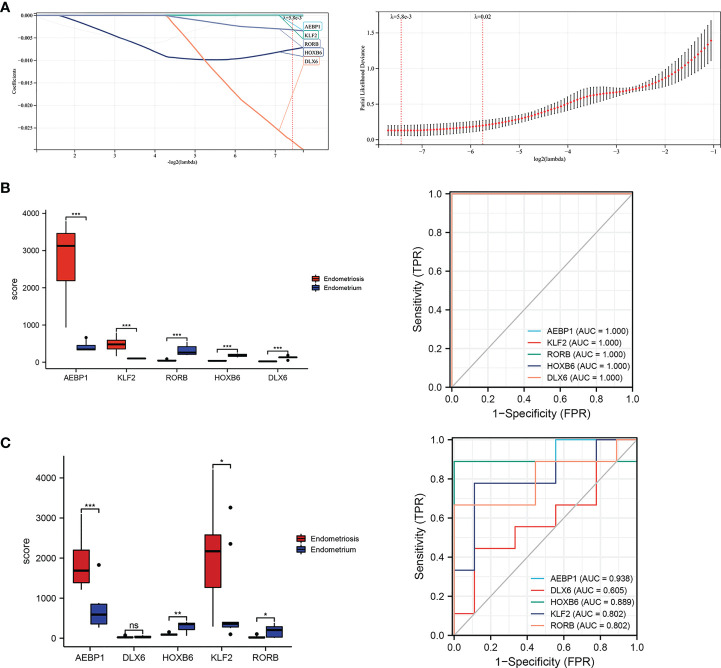
Figure 7.
Lassol model screened TFs diagnostic values both in the training and validation cohorts. (A) Results of the Lasso multivariate model. (B) ROC curves of AEBP1, DLX65, HOXB6, KLF2, and RORB in the GSE7305 dataset. (C) ROC curves of AEBP1, DLX65, HOXB6, KLF2, and RORB in the GSE11691 dataset. *P < 0.05; **P < 0.01; ***P < 0.001; ns, not significant with P > 0.05.

