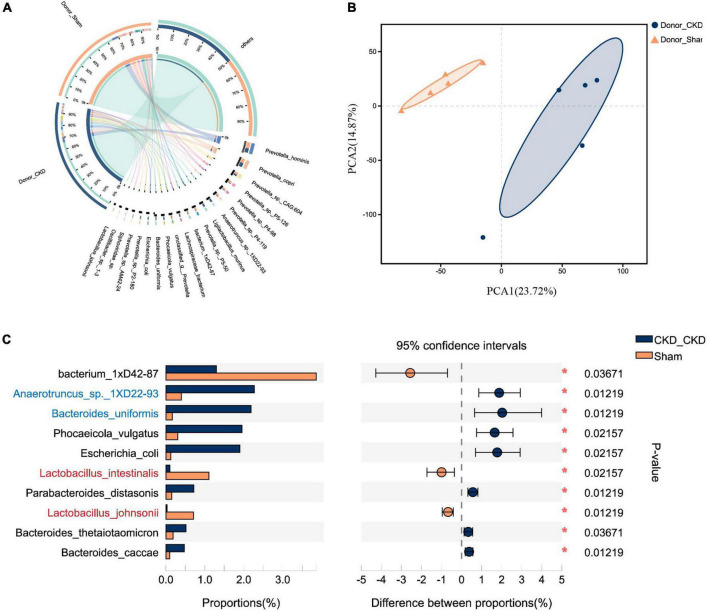
FIGURE 3.
Differences in gut microbiota between Donor CKD and Donor Sham rats. (A) Circos sample-species relationship map. (B) PCA plots of species-level metagenomic expression (PERMANOVA P < 0.05). (C) Differential microbial species (Wilcoxon rank sum test). The vertical coordinates indicate the species names at different taxonomic levels, and the horizontal coordinates indicate the percentage value of the abundance of a species for that sample, with different colors indicating different groupings. Donor Sham, n = 5; Donor CKD, n = 5. *P < 0.05.

