FIGURE 4.
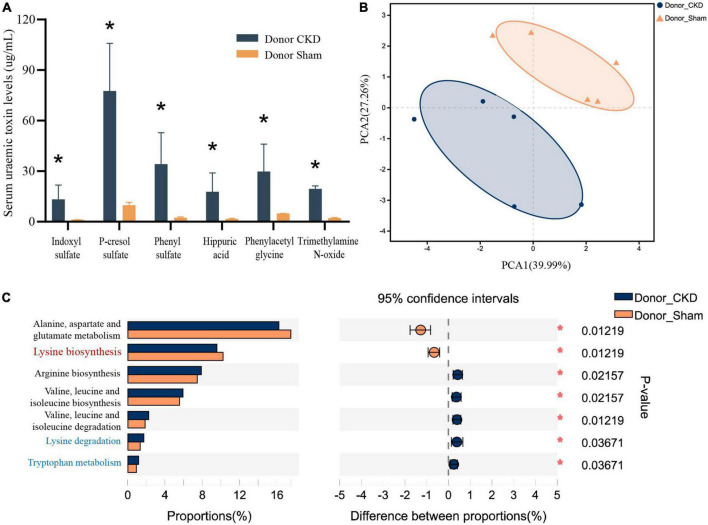
Differences in bacterial amino acid metabolism associated with the KEGG database between Donor CKD and Donor Sham rats. (A) PBUTs levels after successful establishment of a kidney disease model. (B) PCA plots of amino acid metabolism expression (PERMANOVA P < 0.05). (C) Differential amino acid metabolism pathways in gut microbiota (Wilcoxon rank sum test). The vertical coordinates indicate the KEGG function names at different classification levels, and the horizontal coordinates indicate the percentage value of a particular KEGG function abundance for that sample, with different colors indicating different groupings. Donor Sham, n = 5; Donor CKD, n = 5. *P < 0.05.

