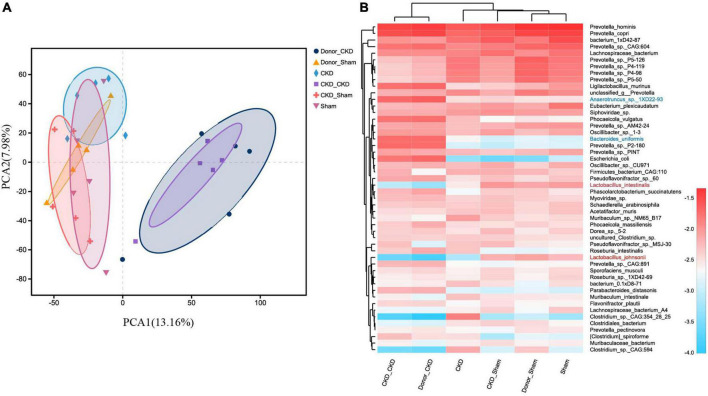
FIGURE 5.
MGS changes after successful FMT. (A) PCA plots of species-level metagenomic expression (PERMANOVA p < 0.05). (B) Heat map of hierarchical clustering analysis of the differentially expressed species. The sample name and species name are shown on the lower and right side of the heat map, respectively, and the species clustering tree and sample clustering tree are shown on the left and upper side if cluster analysis was performed, respectively. The scale of the heat map means z-score.

