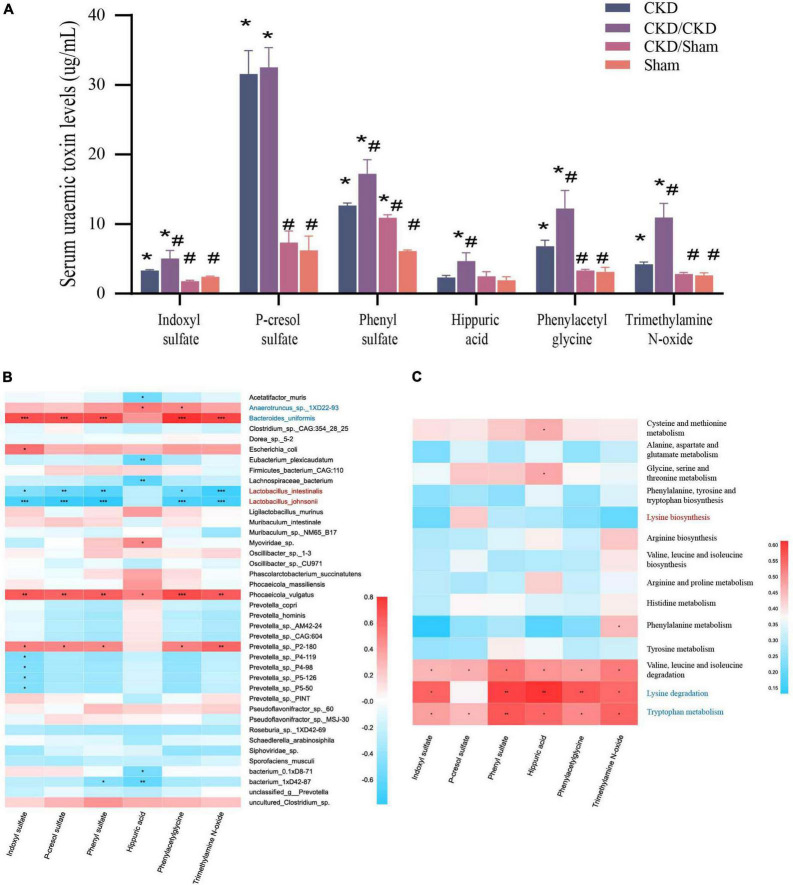
FIGURE 8.
(A) PBUTs levels after FMT. The data is presented as means ± SEM. n = 5. *VS Sham group P < 0.05, #VS group CKD P < 0.05. (B) Correlation heatmap between environmental factors and species with 1/2 nephrectomized after successful FMT. The X and Y axes are environmental factors and species, respectively, and the correlation coefficient R-values and the corresponding P-values were obtained by calculation. The R-values are shown in different colors in the figure, P < 0.05 is marked with *, and the right-hand legend shows the color intervals of different R-values. The clustering of species and environmental factors, respectively, is shown on the left and upper side of the figure. (C) Correlation heatmap between amino acid metabolism function and PBUTs with rats after successful FMT. The X and Y axes are environmental factors and amino acid metabolism function, respectively, and the correlation coefficient R-values and the corresponding P-values were obtained by calculation. The R-values are shown in different colors in the figure, P < 0.05 is marked with *, and the right-hand legend shows the color intervals of different R-values. The clustering of amino acid metabolism function and environmental factors, respectively, is shown on the left and upper side of the figure.

