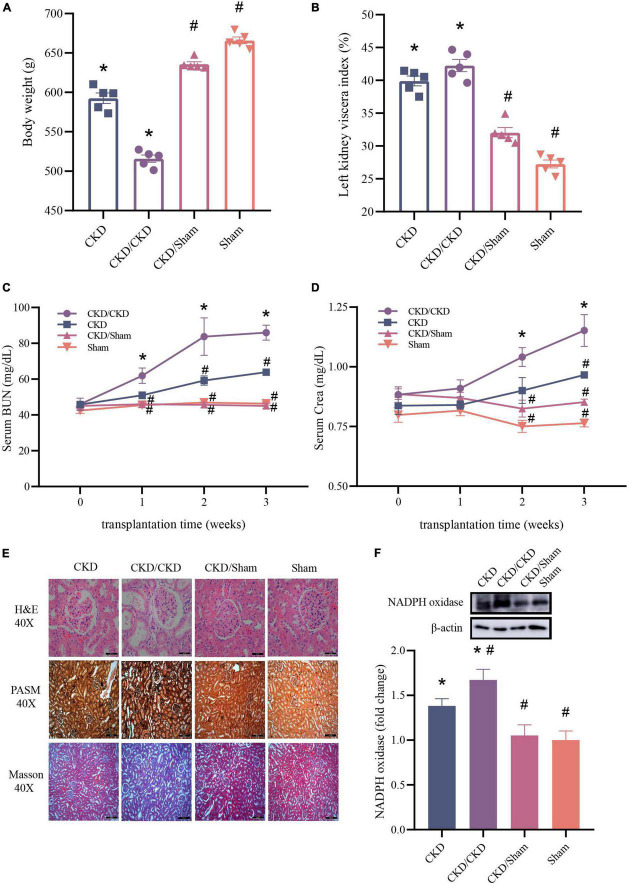
FIGURE 9.
Changes of renal function related indicators after successful FMT. (A) Body weight. (B) Left kidney viscera index. (C) BUN. (D) Crea. (E) Histology of kidney tissue stained with H&E, PASM, and Masson. (F) Western blot results for NADPH oxidase. The data is presented as means ± SEM. n = 5. *VS Sham group P < 0.05, #VS group CKD P < 0.05.

