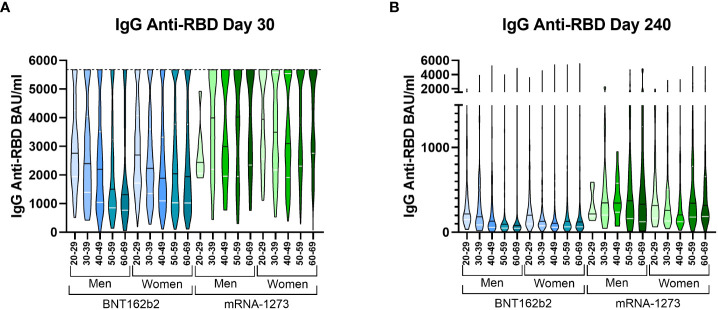
Figure 2.
IgG anti-RBD levels on day 30 and 240 stratified by all three variables simultaneously. Violin plots representing the IgG anti-RBD levels in BAU/ml stratified by vaccine type, gender, and age on day 30 (A) and day 240 (B). The median (black line) and quartiles (white lines) are represented in each violin plot. On day 30, the dotted line at 5,680 BAU/ml indicates the higher limit of quantification. A Kruskal Wallis test and a Dunn’s multiple comparisons test were performed for each variable. IgG anti-RBD levels were calculated in international units (BAU/ml).

