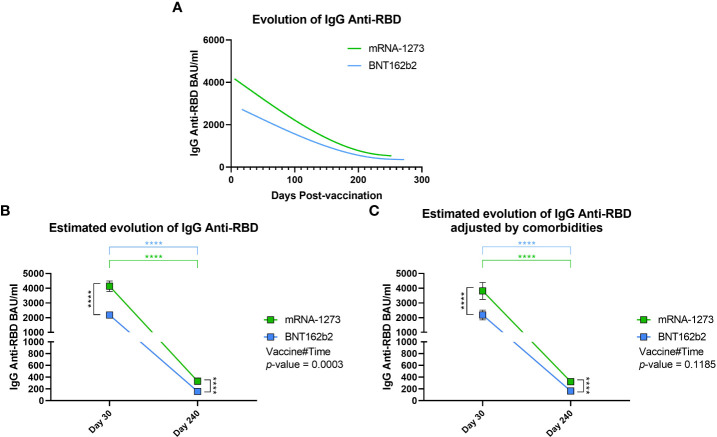
Figure 4.
Evolution of IgG Anti-RBD levels during follow-up. (A) Spline representation of the evolution of IgG anti-RBD levels in both mRNA-1273- and BNT162b2-vaccinated individuals. For each individual, the exact day post-vaccination was selected. The spline representation was made by smoothing the spline with three knots. (B) Estimated evolution of IgG anti-RBD levels for both vaccines adjusted by age and gender, calculated using a mixed-effects model with transformed logarithmic IgG anti-RBD values and with tobit regression. Vaccine#Time indicates the behaviour of each vaccine during the follow-up. Squares indicate the estimated mean, and brackets indicate a 95% confidence interval. (C) In the randomized cohort, the estimated evolution of IgG anti-RBD levels for both vaccines was adjusted by age, gender, and comorbidities in a multivariable analysis. **** p-value < 0.0001.

