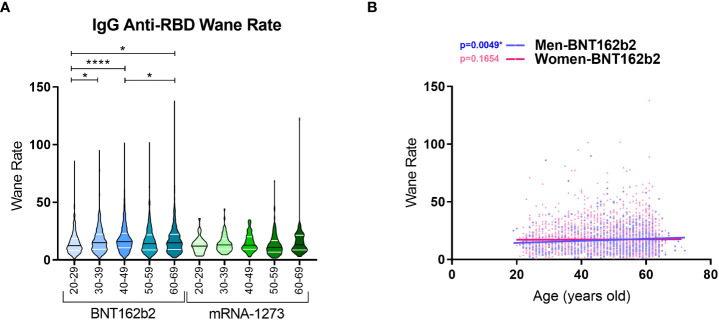
Figure 5.
Wane ratios of IgG anti-RBD levels in BNT162b2- and mRNA-1273-vaccinated individuals with respect to age ranges. (A) Violin plots represent the waning rate of IgG anti-RBD levels for each individual. The wane rate was calculated by dividing the IgG anti-RBD level on day 30 by the IgG Anti-RBD level on day 240 for each individual. The median (black line) and quartiles (white lines) are represented in the violin plots. A Kruskal Wallis test and a Dunn’s multiple comparisons test were performed for each variable. (B) Spearman correlation was calculated for male and female volunteers vaccinated with BNT162b2. * p-value < 0.05, **** p-value < 0.0001.

