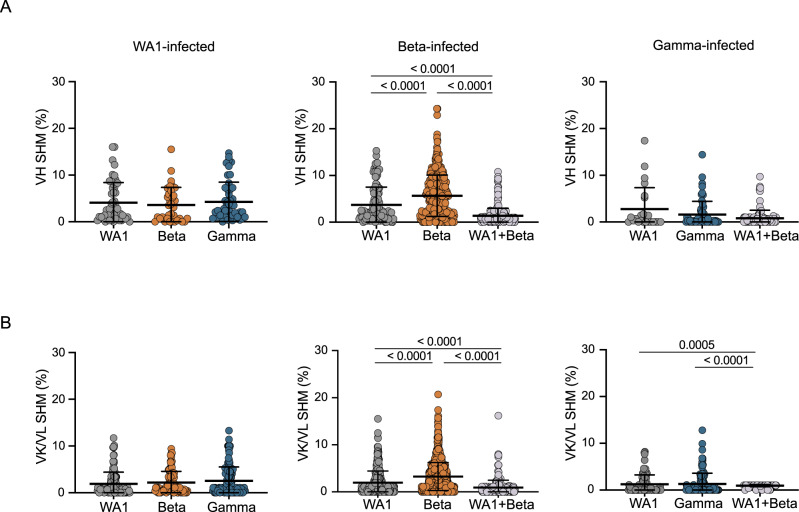
Fig. 4. Somatic hypermutation (SHM) levels of SARS-CoV-2 specific B cells (unpaired sequences). SHM percent in variable heavy (VH).
A or variable kappa/lambda (VK/VL) B regions. Error bars indicate the average percentage of nucleotide substitutions + /- standard deviation. Statistical significance was determined using a two-tailed Mann-Whitney U test. Source data are provided as a Source Data file. In panel A n = 50, 34, and 49 heavy chains, respectively, for WA1-infected individuals; 111, 349, and 277 heavy chains for Beta-infected; and 24, 60, and 106 heavy chains for Gamma-infected. In panel B n = 125, 88, and 136 light chains, respectively, for WA1-infected; 380, 1157, and 289 light chains for Beta-infected; and 81, 112, and 109 light chains for Gamma-infected. These numbers included heavy and light chains from cells for which the cognate light or heavy chain was not recovered.

