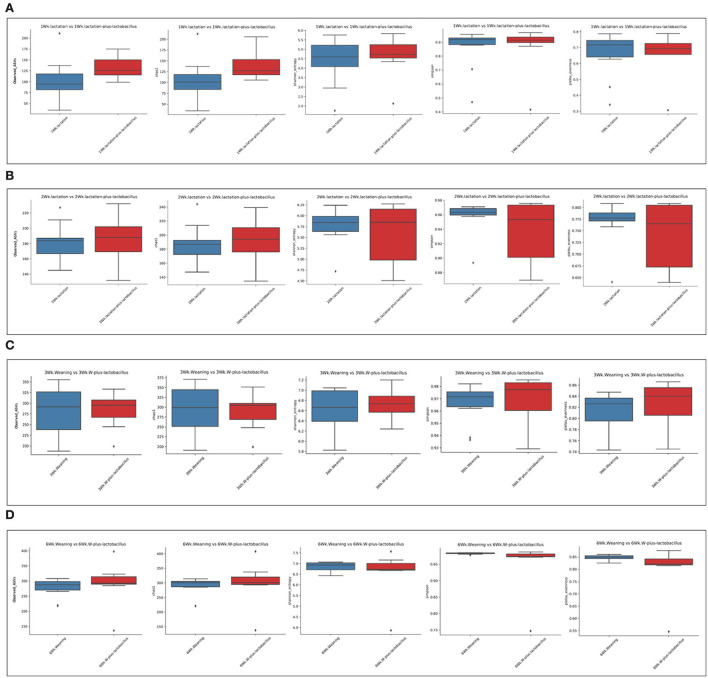
Figure 2.
Alpha-diversity analysis of control and treatment gut microbiome. These box plots show the alpha-diversity estimation scores for each period [(A) week 1, (B) week 2, (C) week 3, and (D) week 6]. Each alpha-diversity was calculated using 1: Observed_ASVs, 2: Chao 1, 3: Shannon_entrophy, 4: Simpson, and 5: Pielou_evenness indices in order.

