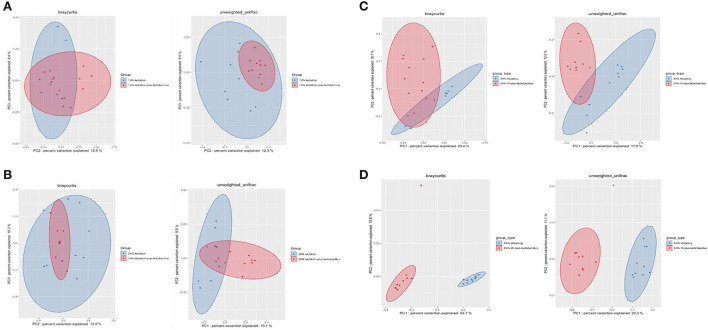
Figure 3.
Beta-diversity analysis of four dependent periods between each piglet. Microbial beta-diversity analysis measured by both Bray–Curtis distance and unweighted UniFrac distance matrix for all samples. Time-series comparison analysis between control and treatment groups at (A) 1, (B) 2, (C) 3, and (D) 6 weeks are represented. The circular clusters represent the distance between control (blue) and treatment (red) groups based on the microbial diversity between the groups and the similarity of the gut microbiomes.

