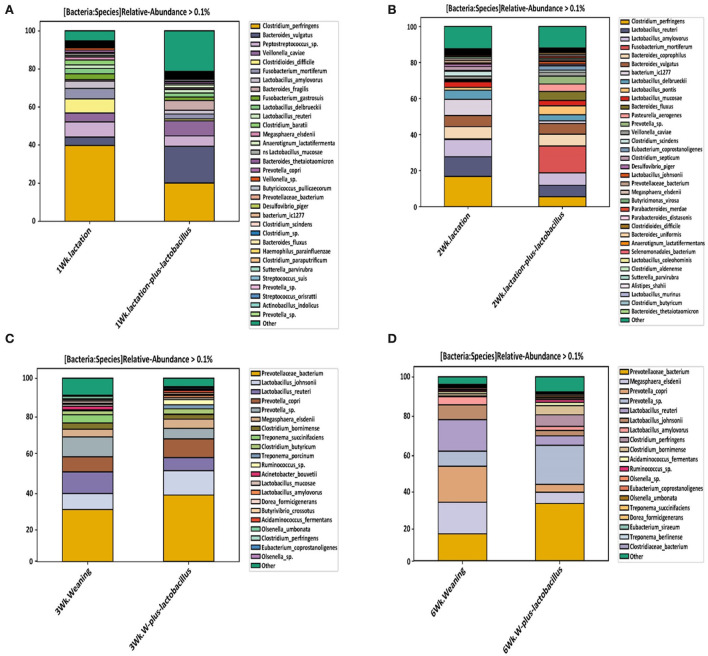
Figure 4.
Relative abundance of bacteria at the species level, depending on the duration of probiotic supplement intake [(A) week 1, (B) week 2, (C) week 3, and (D) week 6]. These relative abundance bar plots represent the bacterial composition of piglet gut microbiota at the species level. Each legend box at right annotates the bacterial taxonomy in the order of higher bacterial composition.

