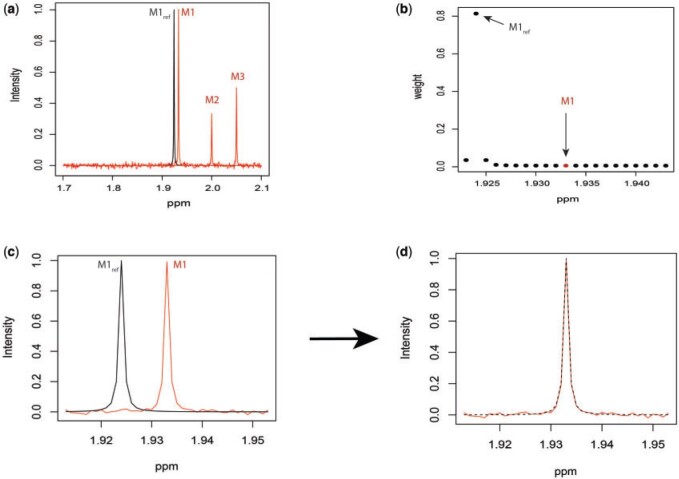
Fig. 2.
Simulated mixture spectrum (three rightmost peaks) with added random noise (a) overlaid with the reference counterpart  (leftmost peak) of
  in the simulation. Weight plot for the shifted peak (b) potentially relocates the shifted peak by detecting the noncentered maximum weight. As a result, shifted peak (c) is corrected to match its referenced peak (d).

