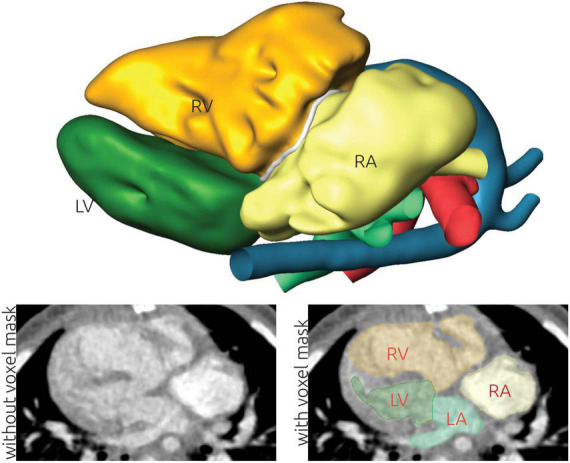
FIGURE 1.

Illustration of the image-based reconstruction of a patient-specific anatomy using computed tomography (CT) data. The top panel shows the resulting 3D surface geometry of the patient. The lower left panel shows a CT image slice without labels. The grayscale window is set to a range from -500 to +500 Hounsfield units. This image is superimposed using the labels generated during image reconstruction in the lower right panel. Here, the left (LA) and right atrium (RA), as well as the left (LV) and right ventricle (RV) are highlighted.
