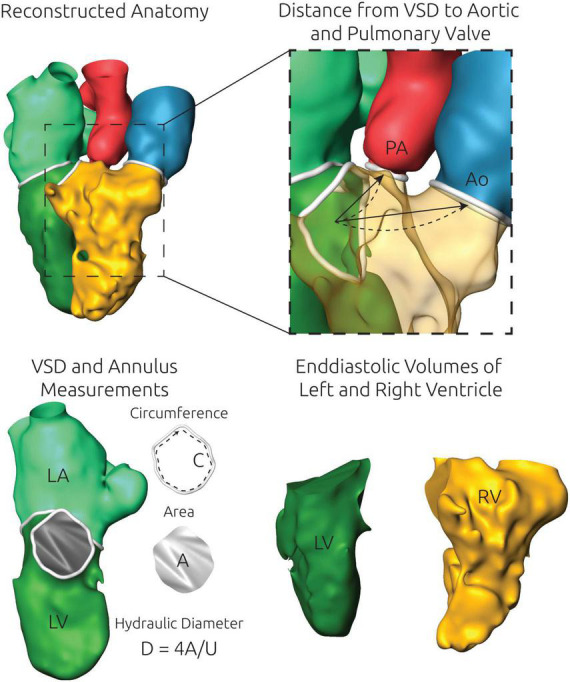
FIGURE 2.

Illustration of the anatomical measurements performed using the specific surface reconstructions of each patient. An exemplary 3D surface geometry is shown in the upper left panel. Top right) The distance from the center of mass of the ventricular septal defect (VSD) and the aortic and pulmonary valve annulus were measured automatically by two approaches. First, the shortest linear connection (arrow) was calculated. Second, a cubic spline (dashed line) was generated to calculate a more realistic curved path. Bottom left) For each valve annulus as well as the VSD, which is shown here exemplarily, the circumference C and the cross-sectional area A were measured. From those two measurements the hydraulic diameter D was calculated. Bottom right) The left (LV) and the right ventricle (RV) were separated from each other and the exact volume of the closed surface geometries of both structures was measured.
