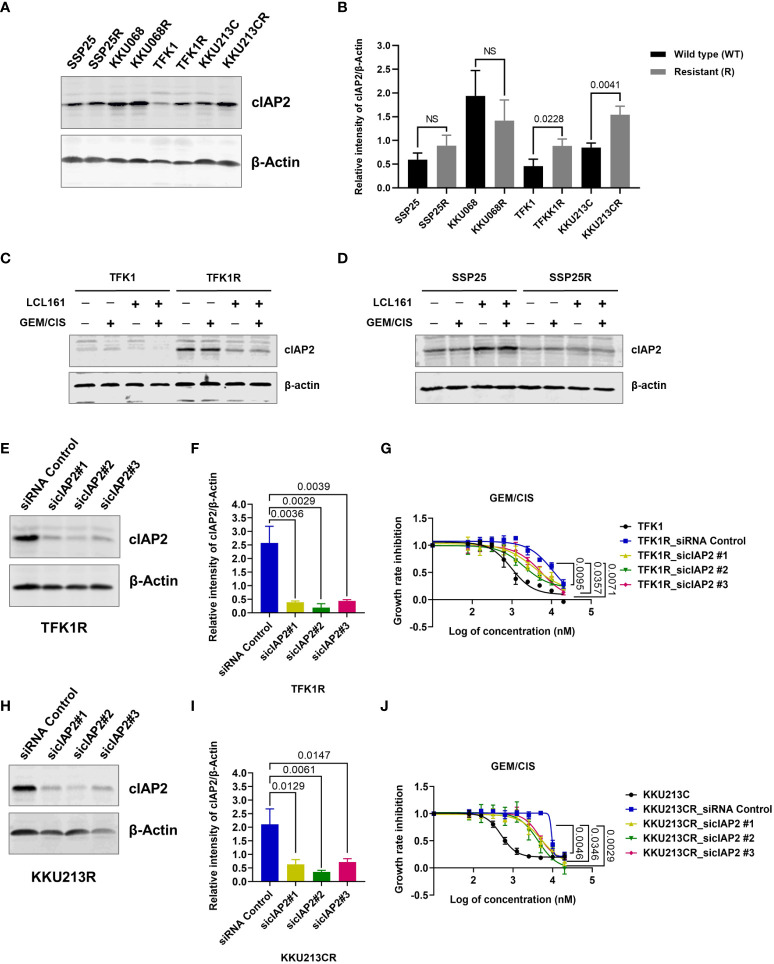
Figure 3.
cIAP2 overexpression mediates GEM/CIS resistance in CCA. (A) Western blot analysis of cIAP2 in parental cells (TFK1, KKU213C, KKU068, and SSP25 cells), compared to their resistant counterparts (TFK1R, KKU213CR, KKU068R, and SSP25R cells). β-actin was used as a protein loading control. A representative result is shown. (B) The bar graphs show the average intensities of 3 replicates ± SD of cIAP2 expression in the indicated cell lines from (A) P-values are shown above the bars. (C, D) Western blot analysis of cIAP2 in TFK1 vs. TFK1R, and SSP25 vs. SSP25R cells under 72 hours of treatment with LCL161, GEM/CIS, or LCL161 + GEM/CIS, as indicated. (E) Western blot analysis of the cIAP2 protein in TFK1R cells transfected with the indicated siRNAs. β-actin was used as a protein loading control. A representative result is shown. (F) The bar graph shows the average intensities of 3 replicates ± SD of the results in (E) P-values are shown above the bars. (G) GEM/CIS dose-response curves for siRNA-mediated cIAP2-depleted TFK1R cell lines. The curves represent the averages of 3 replicates ± SD. P-values are shown at the lower right quadrant of the image. (H) Western blot analysis of the cIAP2 protein in KKU213CR cells transfected with the indicated siRNAs. β-actin was used as a protein loading control. A representative result is shown. (I) The bar graph shows the average intensities of 3 replicates ± SD of the results in (H) P-values are shown above the bars. (J) GEM/CIS dose-response curves for siRNA-mediated cIAP2-depleted KKU213CR cells. The curves represent the averages of 3 replicates ± SD. P-values are shown at the lower right quadrant of the image. NS, not statistically significant.

