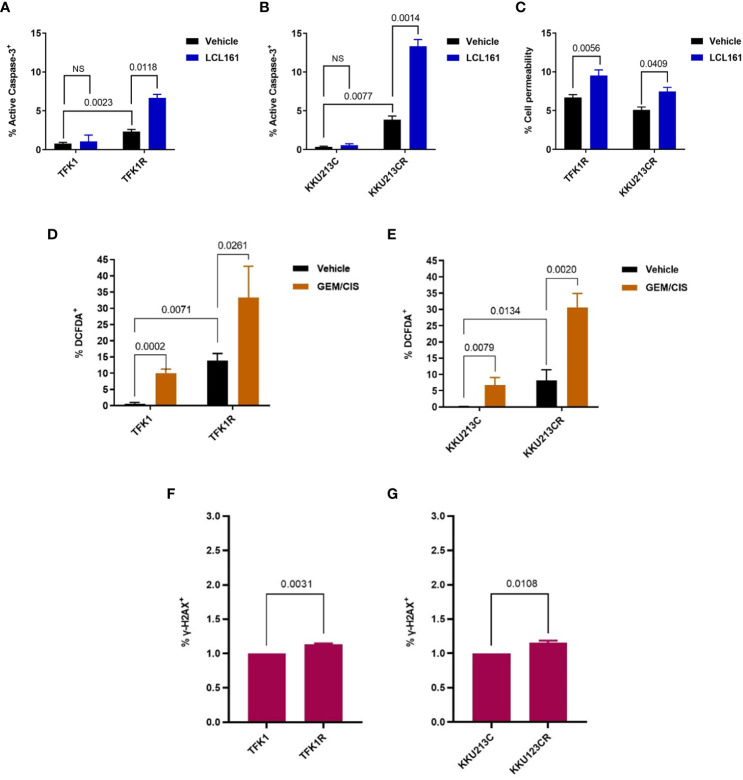
Figure 4.
LCL161-induced apoptosis in TFK1R and KKU213CR cells. (A, B) Percentage of activated caspase 3+ in TFK1, TFK1R, KKU213C, and KKU213CR cells treated with LCL161 or vehicle at 72 hours. (C) Percentage of PI cell permeability in KKU213CR and TFK1R cells treated with LCL161 at 36 hours. (D) Percentage of DCFDA+ TFK1 and TFK1R cells, with GEM/CIS or vehicle at 72 hours. (E) Percentage of DCFDA+ KKU213C and KKU213CR cells, with GEM/CIS or vehicle at 72 hours. (F, G) Percentage of γ-H2AX+ TFK1, TFK1R, and KKU213C, KKU213CR cells. Bars show the mean of 3 replicates ± SD. P-values are shown. NS, not statistically significant.

