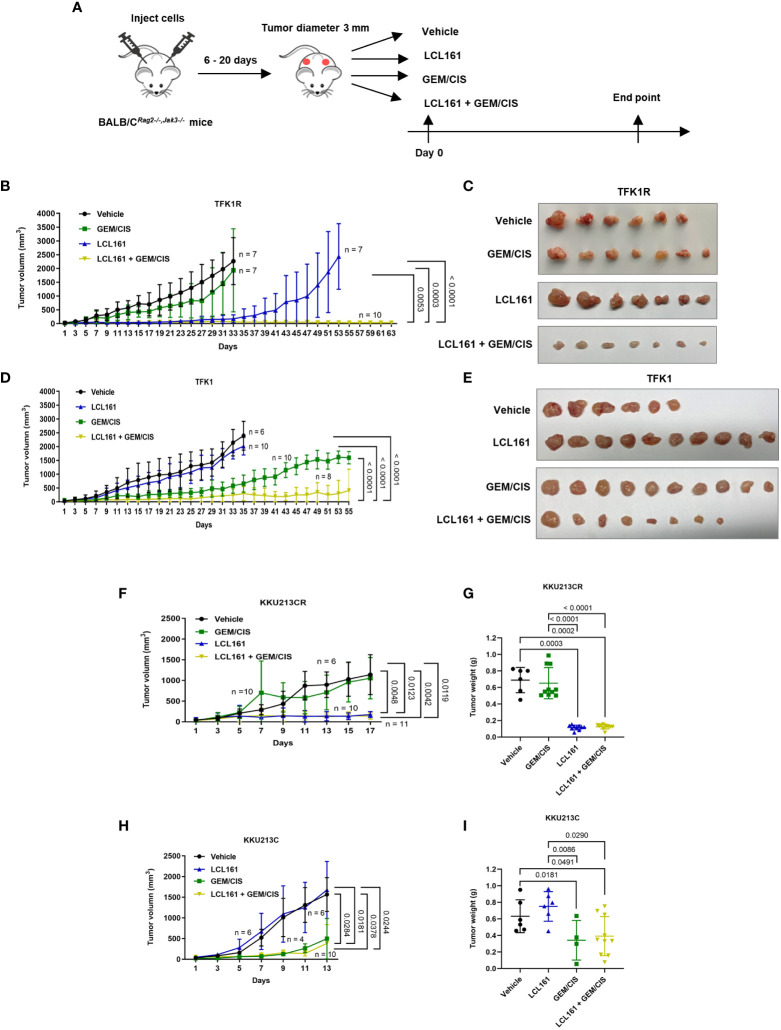
Figure 7.
The effectiveness of triplet LCL161 + GEM/CIS therapy in in vivo models of GEM/CIS resistance. (A) BALB/C Rag2-/-/Jak3-/- mice were subcutaneously injected with GEM/CIS-resistant cells. When the tumor reached 3 mm in diameter, the mice were intraperitoneally treated with vehicle, LCL161, GEM/CIS, or triplet LCL161 + GEM/CIS. (B) Growth of TFK1R tumors from the beginning to the end of the experiment under various treatments. The lines show the averages of tumor size ± SD. P-values are shown at the right lower quadrant of the image. (C) Pictorial images of the tumor from the beginning to the end of treatment for each drug regimen from image (B, D) Growth of TFK1R tumors from the beginning to the end of the experiment under various treatments. The lines show the averages of tumor size ± SD. P-values are shown at the right lower quadrant of the image. (E) Pictorial images of the tumor from the beginning to the end of treatment for each drug regimen from image (D, F) Growth of KKU213CR tumors from the beginning to the endpoint, on which the untreated controls reach the critical size. The lines show the averages of tumor size ± SD. P-values are shown at the right lower quadrant of the image. (G) KKU213CR tumor weight compared among the 4 treatments. The bars indicate the average tumor weight ± SD. P-values are shown at the top of the 4 columns. (H) Growth of KKU213C tumors from the beginning to the endpoint, on which the untreated controls reach the critical size. The lines show the averages of tumor size ± SD. P-values are shown at the right lower quadrant of the image. (I) KKU213C tumor weight compared among the 4 treatments. The bars indicate the average tumor weight ± SD. P-values are shown at the top of the 4 columns. (n = number of tumors).

