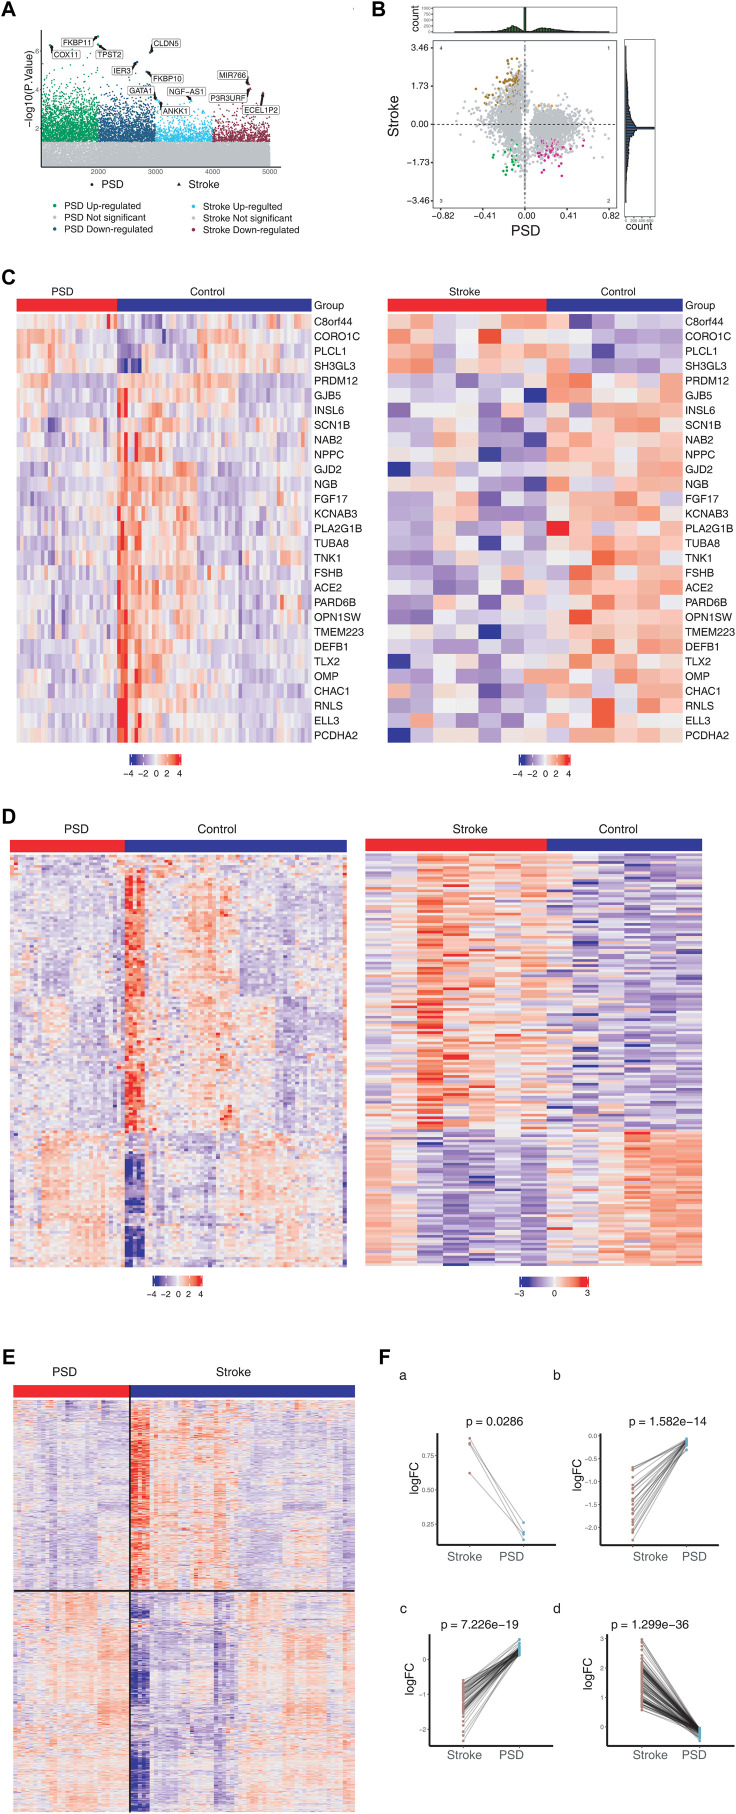
FIGURE 1.
Molecular characteristics of stroke and PSD patients. (A). Manhattan diagram depicting dysregulated genes in stroke and PSD patients. (B). Quadrant chart presenting the expression pattern of genes in stroke and PSD patients. (C). Heatmap indicating consistent upregulation of gene expression in stroke and PSD patients. (D). Heatmap indicating genes that are dysregulated in opposite directions in stroke and PSD patients. (E). Heatmap revealing the expression of depression-specific genes in PSD patients and stroke. (F). Paired scatterplot depicting the expression of genes in stroke and PSD patients.

