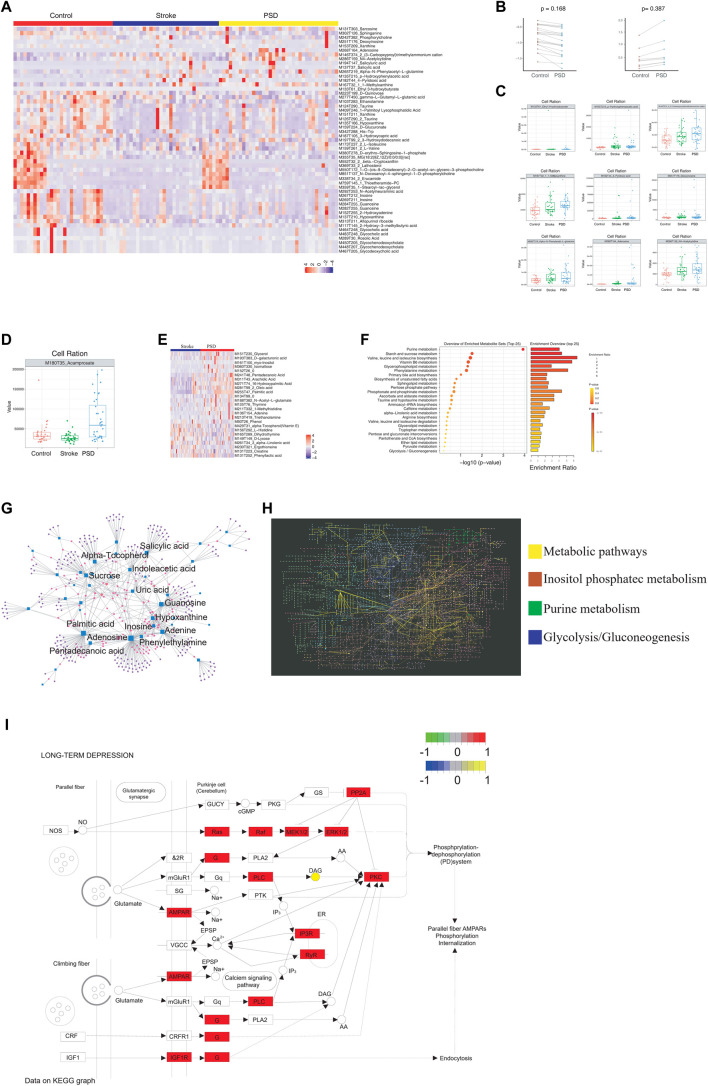
FIGURE 4.
Atlas of abnormal blood metabolism in patients with PSD. (A). Heatmap depicting abnormal metabolites common to stroke and PSD patients. (B). Paired scatterplot depicting continuous changes in total abnormal metabolites. (C). Box plot depicting abnormal metabolites that continue to increase during the process from control-stroke-PSD. (D). Box plot depicting abnormal metabolites associated with excessive recovery during the process from control-stroke-PSD. (E). Heatmap depicting differences in metabolites between stroke and post-stroke depression patients. (F). Metabolic pathway enrichment analysis. (G). Network diagram depicting genes (circles) and metabolites (squares). The size of the dot represents the degree value. (H). KEGG global metabolic network depicting differentially expressed genes and differential metabolites between PSD and stroke patients. Significant pathways are highlighted with a specific color. (I). Pathway map of “long-term depression”.

