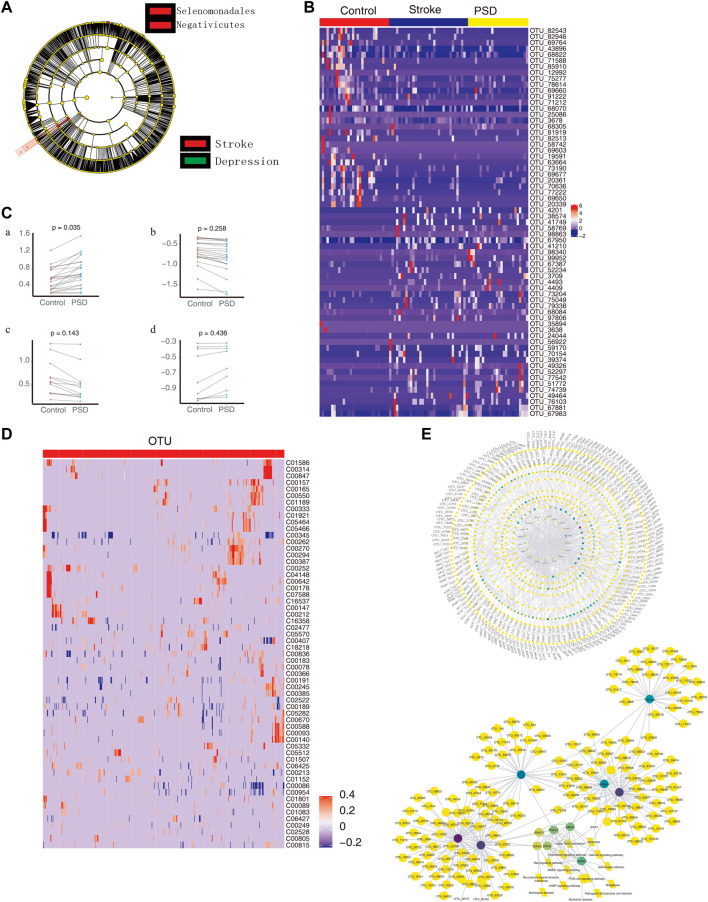
FIGURE 6.
Intestinal microbes contribute to PSD depression with metabolic pathways. (A). Evolutionary clade diagram. Group B indicates stroke patients; group C indicates PSD patients. (B). Heatmap depicting the expression of common dysregulated microbes in healthy controls, stroke, and post-stroke depression patients. (C). Paired scatterplot depicting changes in the abundance of common dysregulated microbes in stroke and post-stroke depression patients. (D). Correlation between dysregulated microorganisms and dysregulated metabolites. (E). Global control network depicting differentially expressed genes (hexagons), metabolites (circles), microorganisms (squares), and pathways (diamonds). Note: Group B consists of stroke patients, and group C consists of PSD patients.

