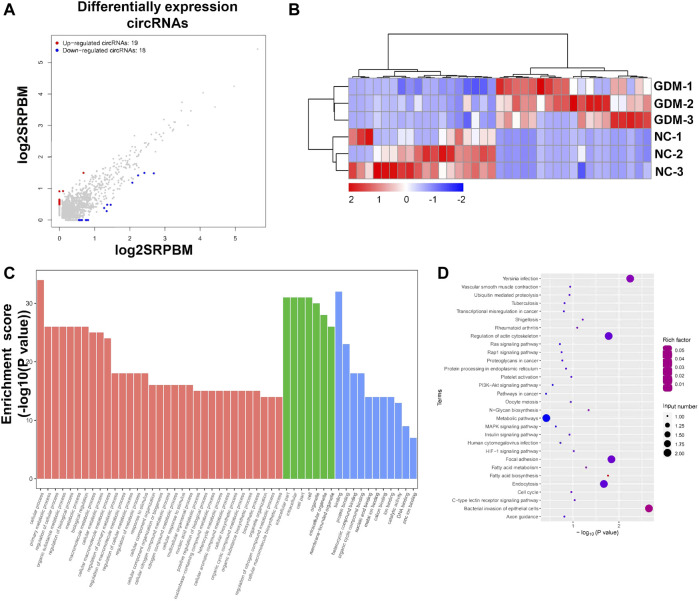
FIGURE 2.
Annotation of differentially expressed circRNAs and GO and KEGG pathways of host genes. (A) Scatter plot showing the deregulated circRNAs in NC and GDM placentas. Significantly regulated genes had an FDR ≤ 0.05 and a fold change ≥ 2. (B) Heatmap showing the differences in circRNA expression between NC and GDM placentas. (C) Top 50 GO terms for parent genes with significantly differentially expressed circRNAs. (D) KEGG pathway enrichment analysis of parent genes with significantly differentially expressed circRNAs. The top 20 KEGG signaling pathways are annotated.

