
Figure 1. Alterations to circulating neutrophil phenotype during acute SARS-CoV-2 infection.
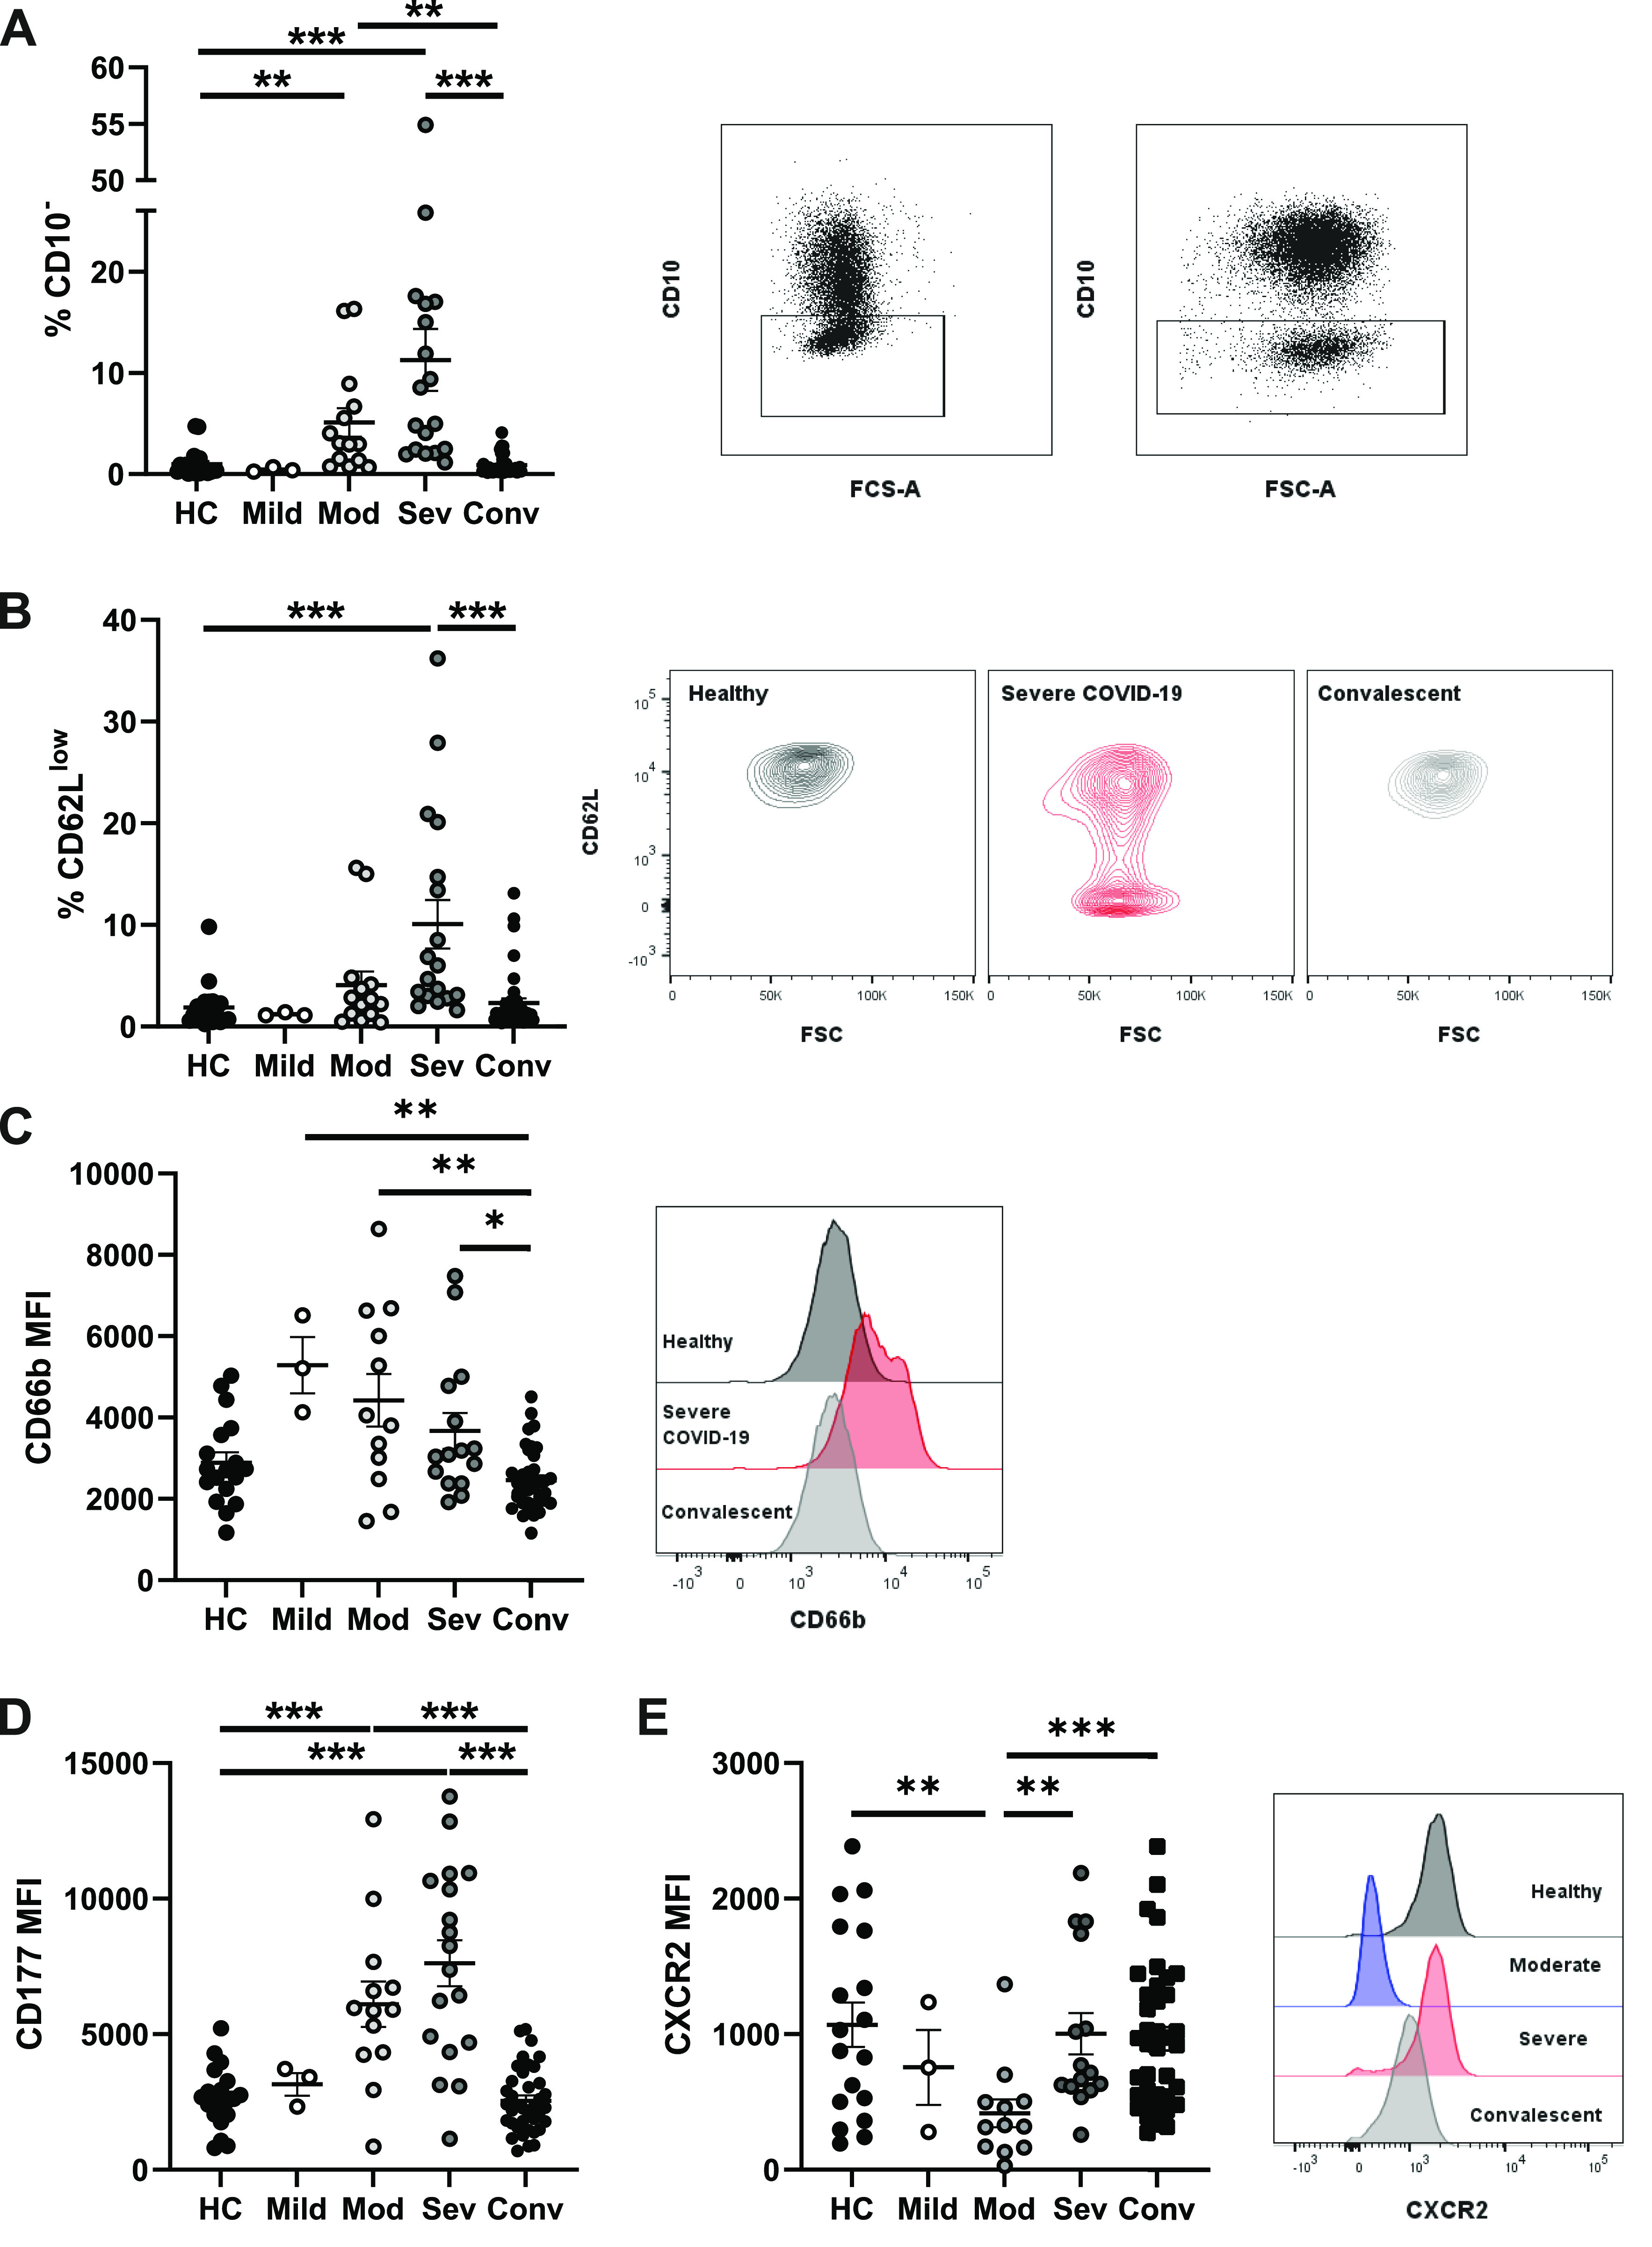
Peripheral blood from healthy controls, convalescent, and acute COVID-19 patients was analysed by flow cytometry. (A) Percentage of CD10− neutrophils from stratified groups (n = HC-20, mild 3, mod 14, sev 18, and conv 38) and representative gating for CD10− neutrophils from two severe patients. (B) Percentage of CD62Llow neutrophils and representative contour plots of CD62L expression (n = HC-20, mild 3, mod 14, sev 18, and conv 38). (C) Neutrophil CD66b median fluorescent intensity and representative histogram of CD66b fluorescent intensity (n = HC-20, mild 3, mod 12, sev 15, and conv 38). (D) CD177 median fluorescent intensity on CD177+ neutrophils (n = HC-20, mild 3, mod 13, sev 18, and conv 38). (E) Neutrophil CXCR2 median fluorescent intensity and representative histogram of CXCR2 fluorescent intensity (n = HC-18, mild 3, mod 12, sev 15, and conv 38). Statistical tests were performed as outlined below. (A, B) Data were analysed by the Kruskal–Wallis test, with Dunn’s multiple comparisons displayed on the graph. (C, D, E) Data were log transformed and analysed by one-way ANOVAs with Tukey’s multiple comparisons displayed on the graph. HC, healthy controls; Mod, moderate; Sev, severe; Conv, convalescent. Values represent mean ± SD.