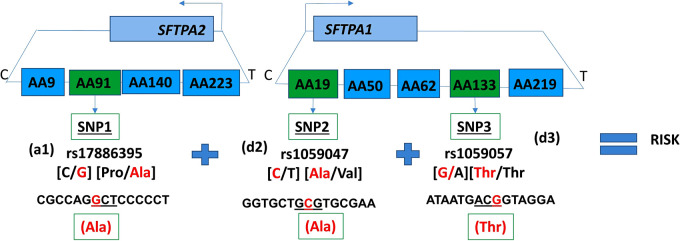
Figure 2.
Intergenic three SNP interaction and RDS susceptibility. It shows the schematic presentation of SFTPA2 and SFTPA1 on the top and the arrows depict the opposite transcriptional orientation. The relative location of SNPs is shown from centromere (C) to telomere (T) and each box represents the amino acid number that includes the particular SNP. For example, AA91 denotes the rs17886395 SNP, AA19 denotes the rs1059047 SNP, and AA133 denotes the rs1059057 SNP. In this three SNP intergenic interaction, underneath the green boxes are the SNP ID and the SNPs involved. The additive effect of SNP1, rs17886395G variant that codes for alanine (highlighted in red) interacts with SNP2 and SNP3 of SFTPA1 in a dominant effect and increases risk of RDS.

