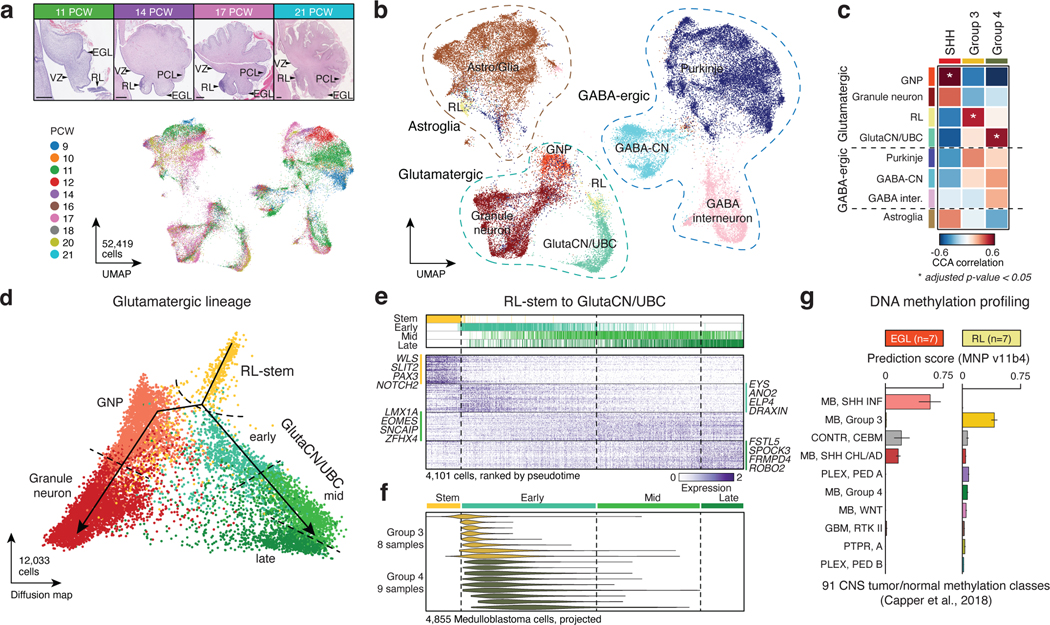
Figure 1. Molecular signatures align Group 3/4-MB with the human fetal RL.
(a,b) UMAP plots summarizing developmental stages (a) and cellular lineages (b) of the fetal human cerebellar atlas. H&E staining images shown in (a) highlight anatomical compartments. Scale bars, 500μm. RL, rhombic lip; VZ, ventricular zone; EGL, external granule layer; PCL, Purkinje cell layer. (c) CCA correlation of bulk MB transcriptomes versus cerebellar lineages. P-values were calculated using a permutation test. (d) Pseudotime diffusion map of glutamatergic lineages and cell states extracted from the human cerebellar atlas. (e) Pseudotime ordering of single-cells derived from the RL-GlutaCN/UBC trajectory according to underlying cell state. (f) Predicted pseudotime ordering of MB single-cells by RL-GlutaCN/UBC cell state. (g) DNA methylation-based classification of micro-dissected human fetal EGL (n=7) and RL (n=7) samples. Error bars represent standard error of the mean.

