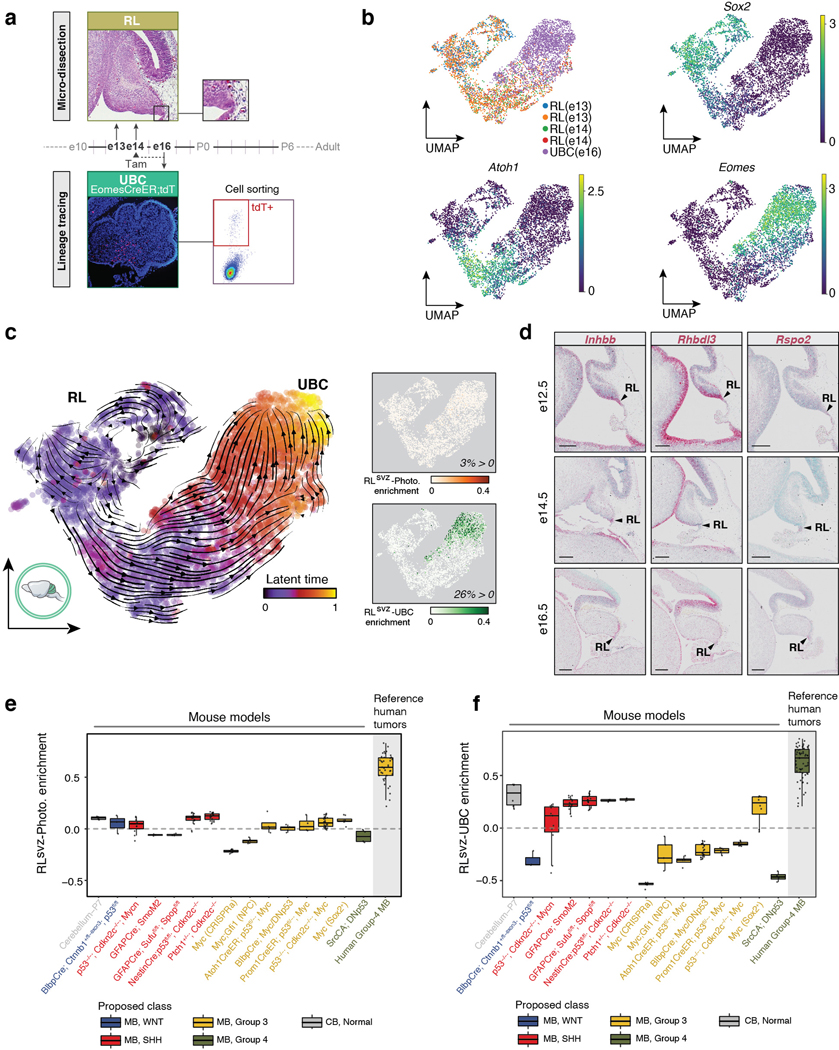
Extended Data Figure 9. Quantification of photoreceptor and UBC gene sets in murine MB models.

(a) Enrichment strategy for isolating the murine RL-UBC lineage. (b) UMAP plots of the enriched murine RL-UBC trajectory, showing experimental source and select marker gene expression. (c) (Left panel) Latent time analysis of RL-UBC lineage-enriched single-cells. (Right panels) Enrichment quantification of the RLsvz-photoreceptor and -UBC gene sets in the murine RL-UBC lineage trajectory. (d) ISH of photoreceptor marker genes in murine cerebellum. Scale bars, 200μm. (e,f) Boxplots summarizing enrichment of the RLsvz-photoreceptor (e) and UBC (f) gene sets across published murine MB transcriptional datasets (n=14). Human MB and normal P7 cerebellum datasets were included as a reference. All boxplots were created as described in Figure 2c.
