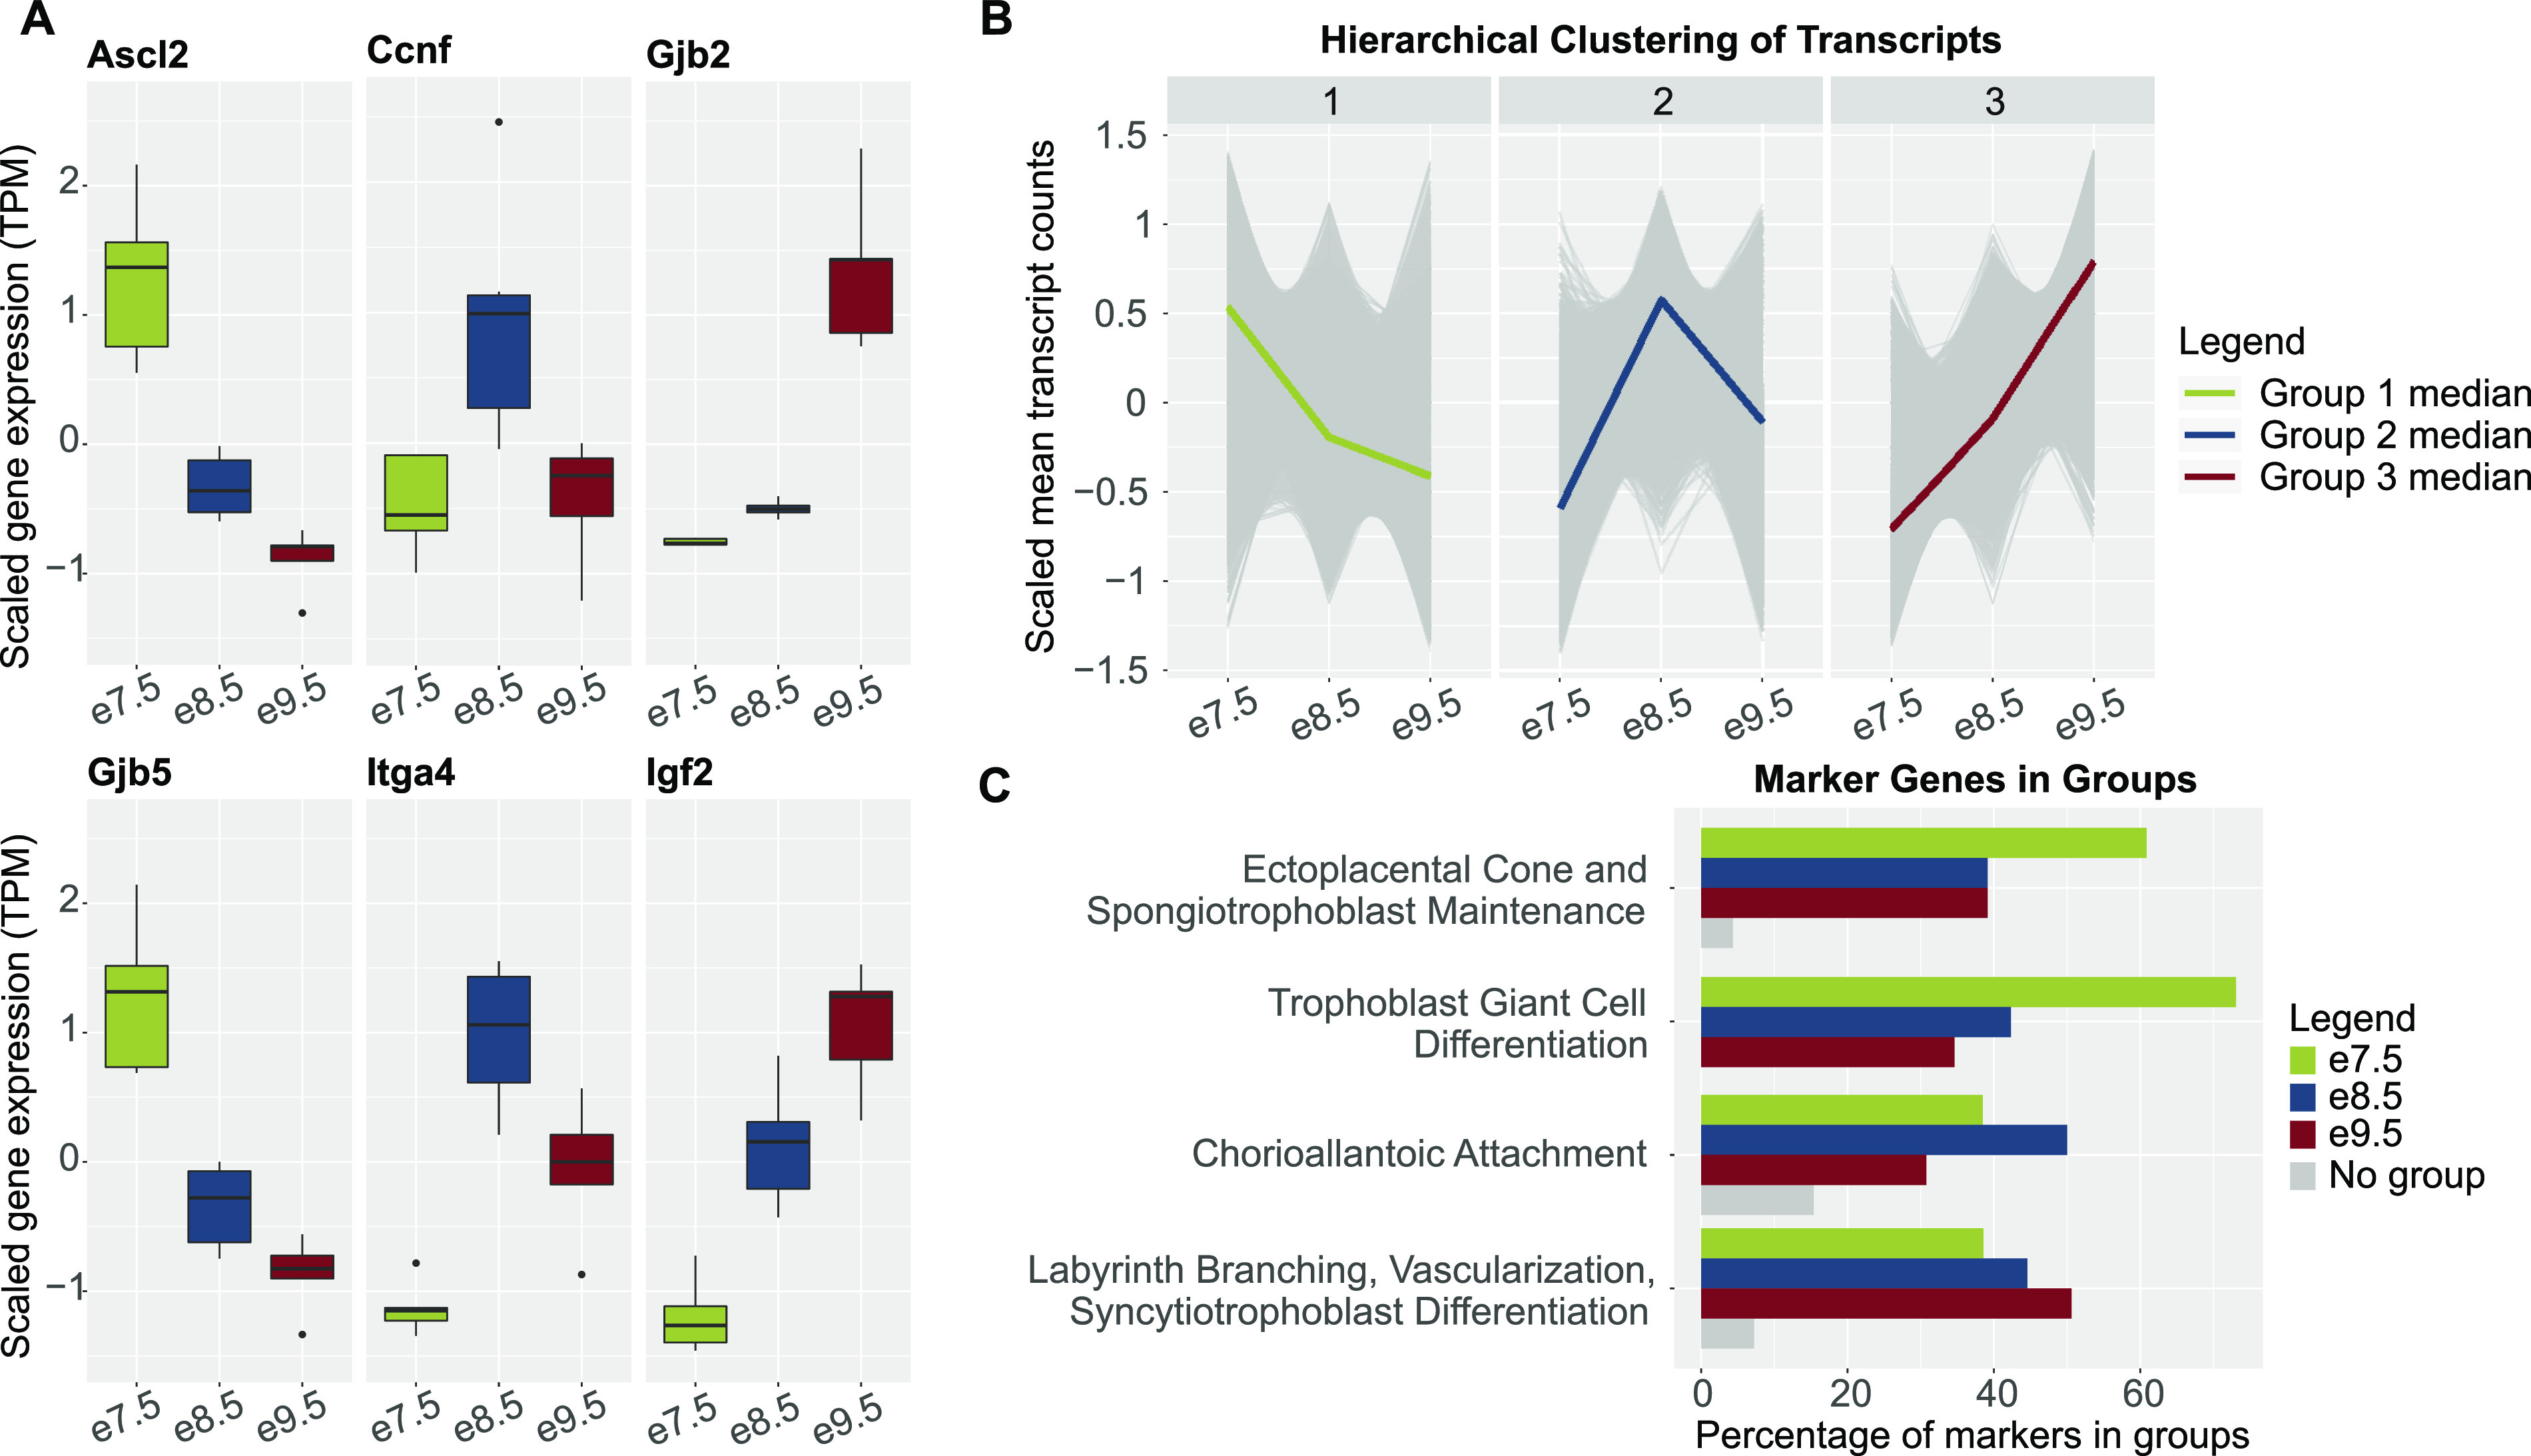
Figure 1. Genes associated with distinct placental processes show timepoint-specific expression.

(A) Boxplots of scaled mean expression (in transcripts per million, TPM) of marker genes showing timepoint-specific patterns. Ascl2 and Gjb5, expected to peak at e7.5, markers of trophoblast proliferation and differentiation (8, 30); Ccnf and Itga4, expected to peak at e8.5, markers of chorioallantoic attachment (31, 32); and Gjb2 and Igf2, expected to peak at e9.5, markers of nutrient transport (33, 34). (B) Line charts of scaled mean raw counts of transcripts in hierarchical clusters showing group median expression levels peak at each timepoint. (C) Bar plots showing that timepoint-associated hierarchical clusters captured most genes underlying distinct placental processes. Markers of timepoint-associated placental processes were obtained from previously published review articles (5, 18, 19, 20, 21). Green, markers in hierarchical cluster with a median expression level highest at e7.5; blue, markers in hierarchical cluster with a median expression level highest at e8.5; dark red, markers in hierarchical cluster with a median expression level highest at e9.5; and gray, markers in no hierarchical clusters.
