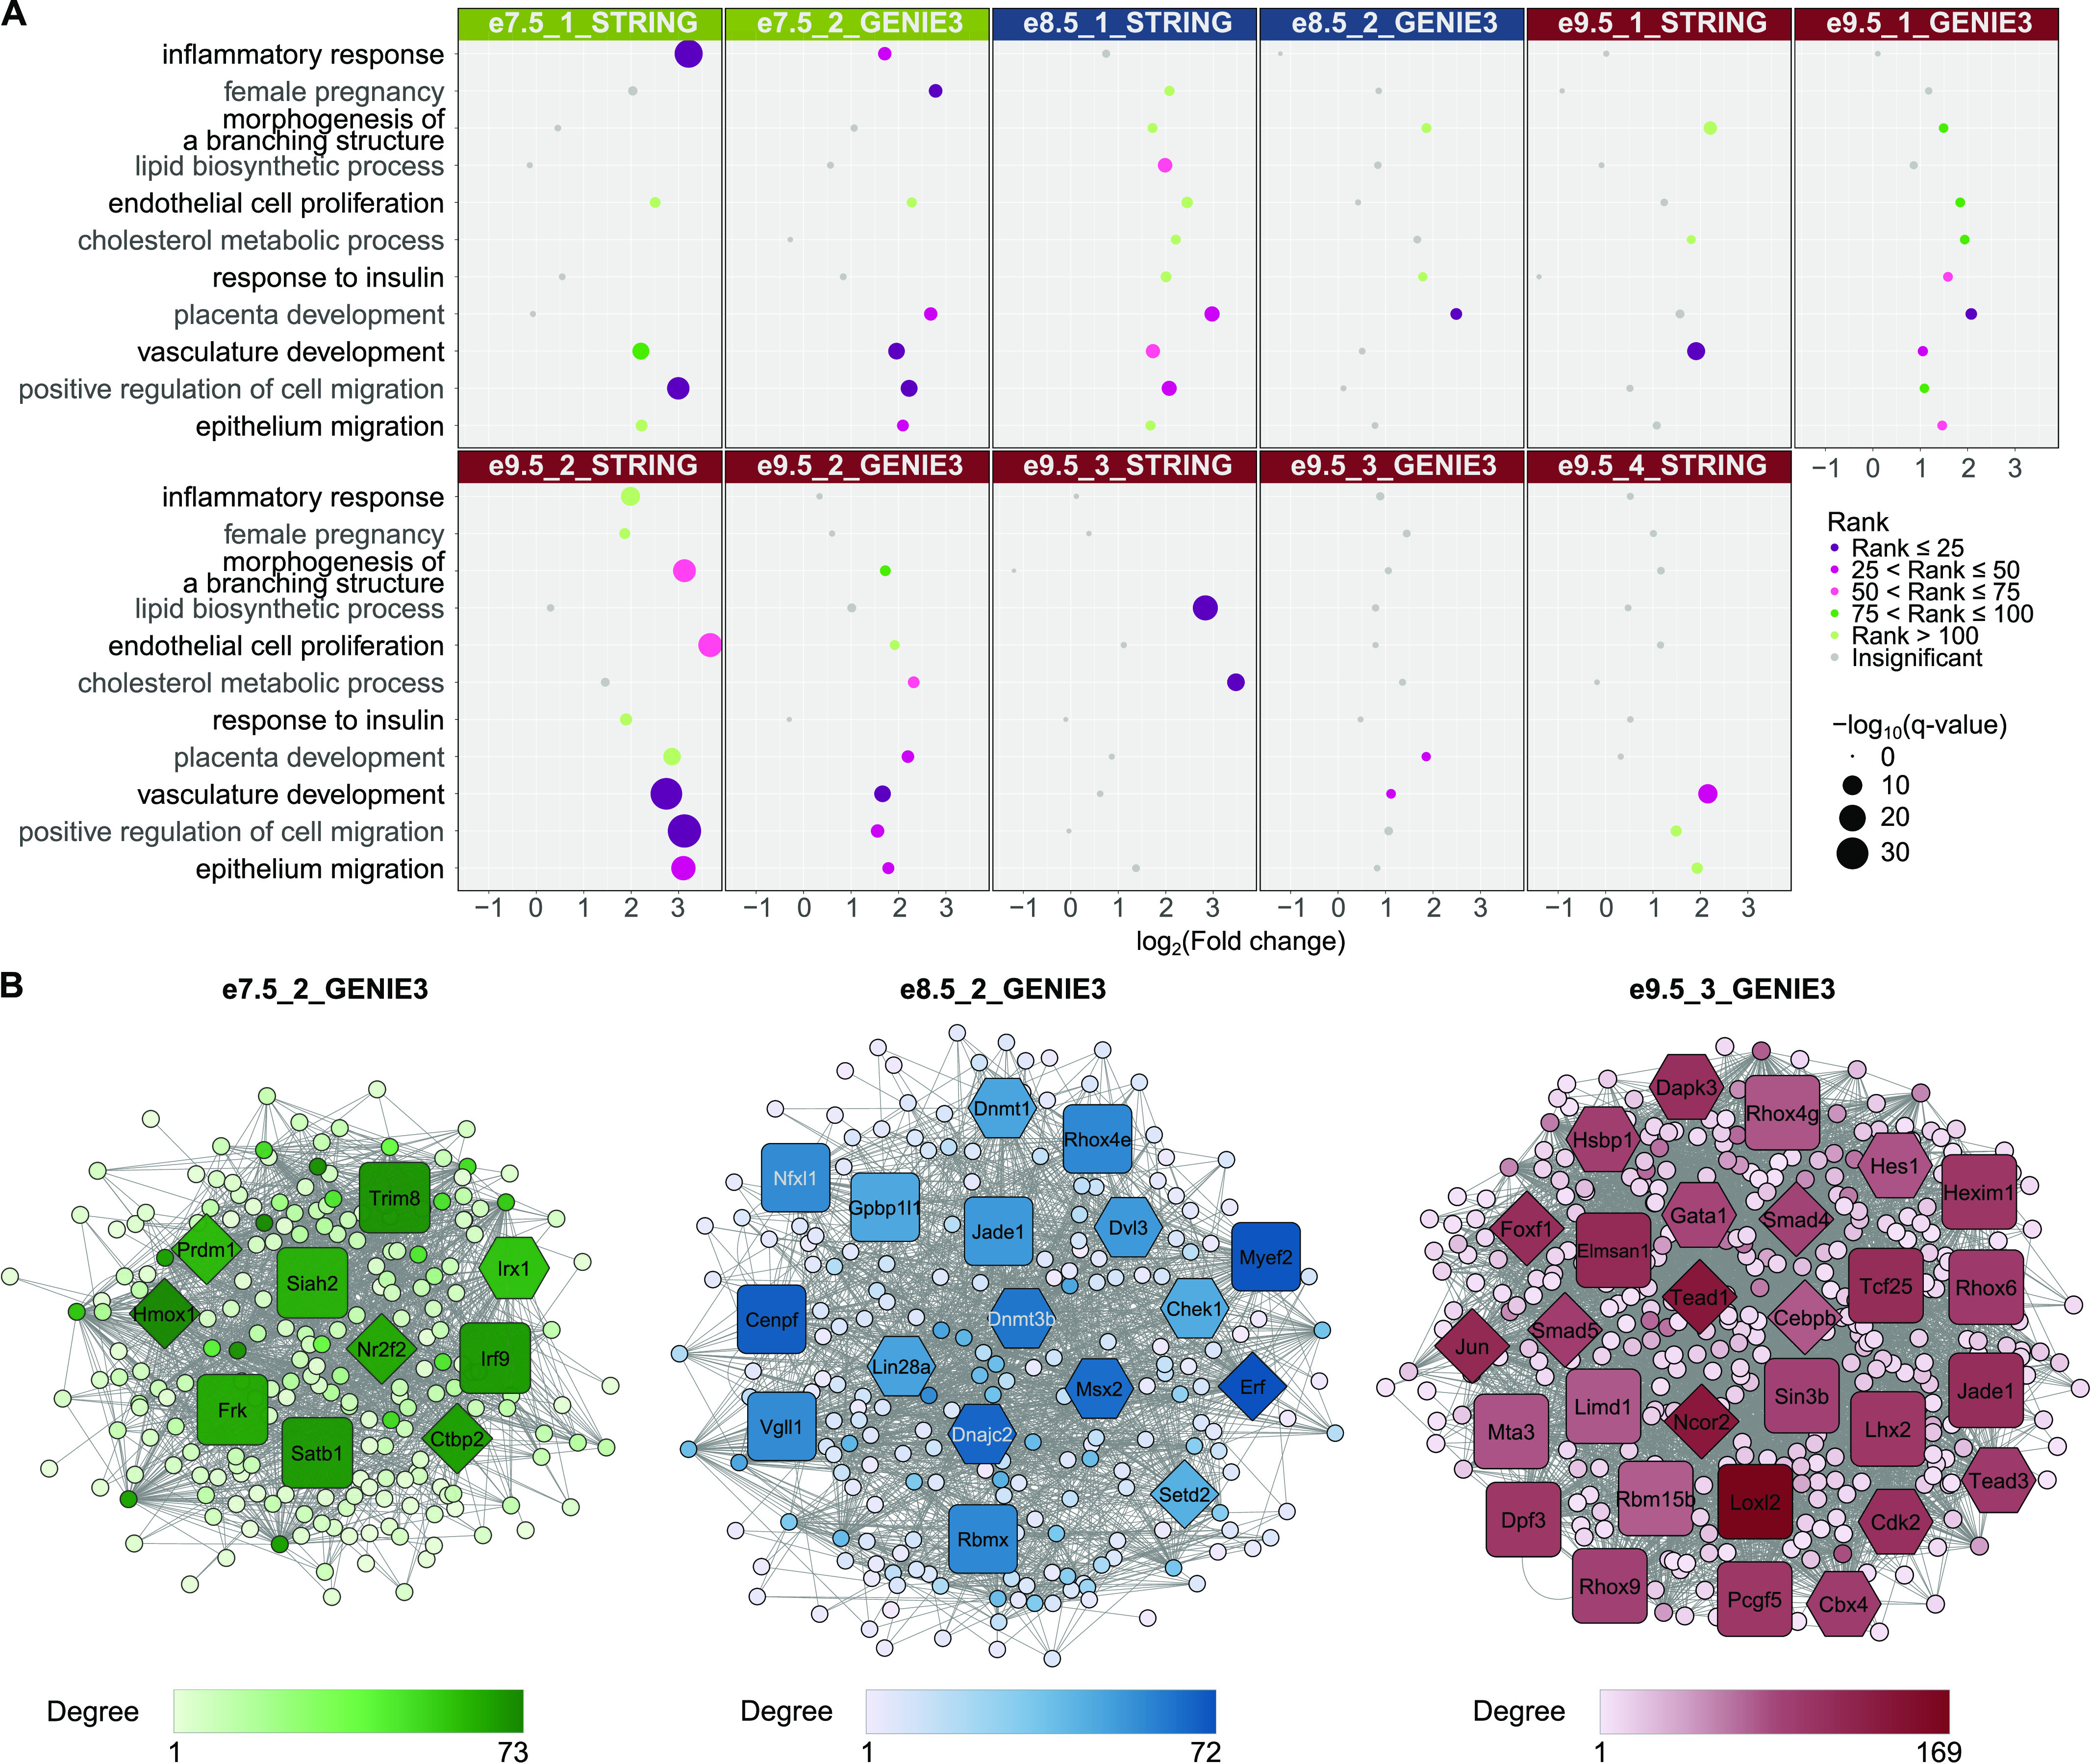
Figure 2. Network analysis identifies gene modules with relevant functions and reveals potential regulators of placental development.

(A) Gene ontology (GO) analysis of networks demonstrates the association of gene sets with placental development processes. Only selected terms are shown. Dot colors correspond to ranks of the terms in each analysis; dot sizes correspond to −log10(q-value). A GO term is considered enriched if its q-value ≤ 0.05, fold change ≥ 2, and the number of observed genes ≥ 5. For full GO enrichment analysis, see Table S5. (B) Network analysis highlights potential regulators of placental development. (A) Only a subset of networks with enriched terms from (A) are shown. Diamond shape, hub genes with known roles in placenta; hexagon, hub genes with possible roles in placenta; and rounded square, hubs without related annotation. Color: the darker the color is, the higher the node’s degree centrality is. For visualization of all other subnetworks, see Fig S3.
