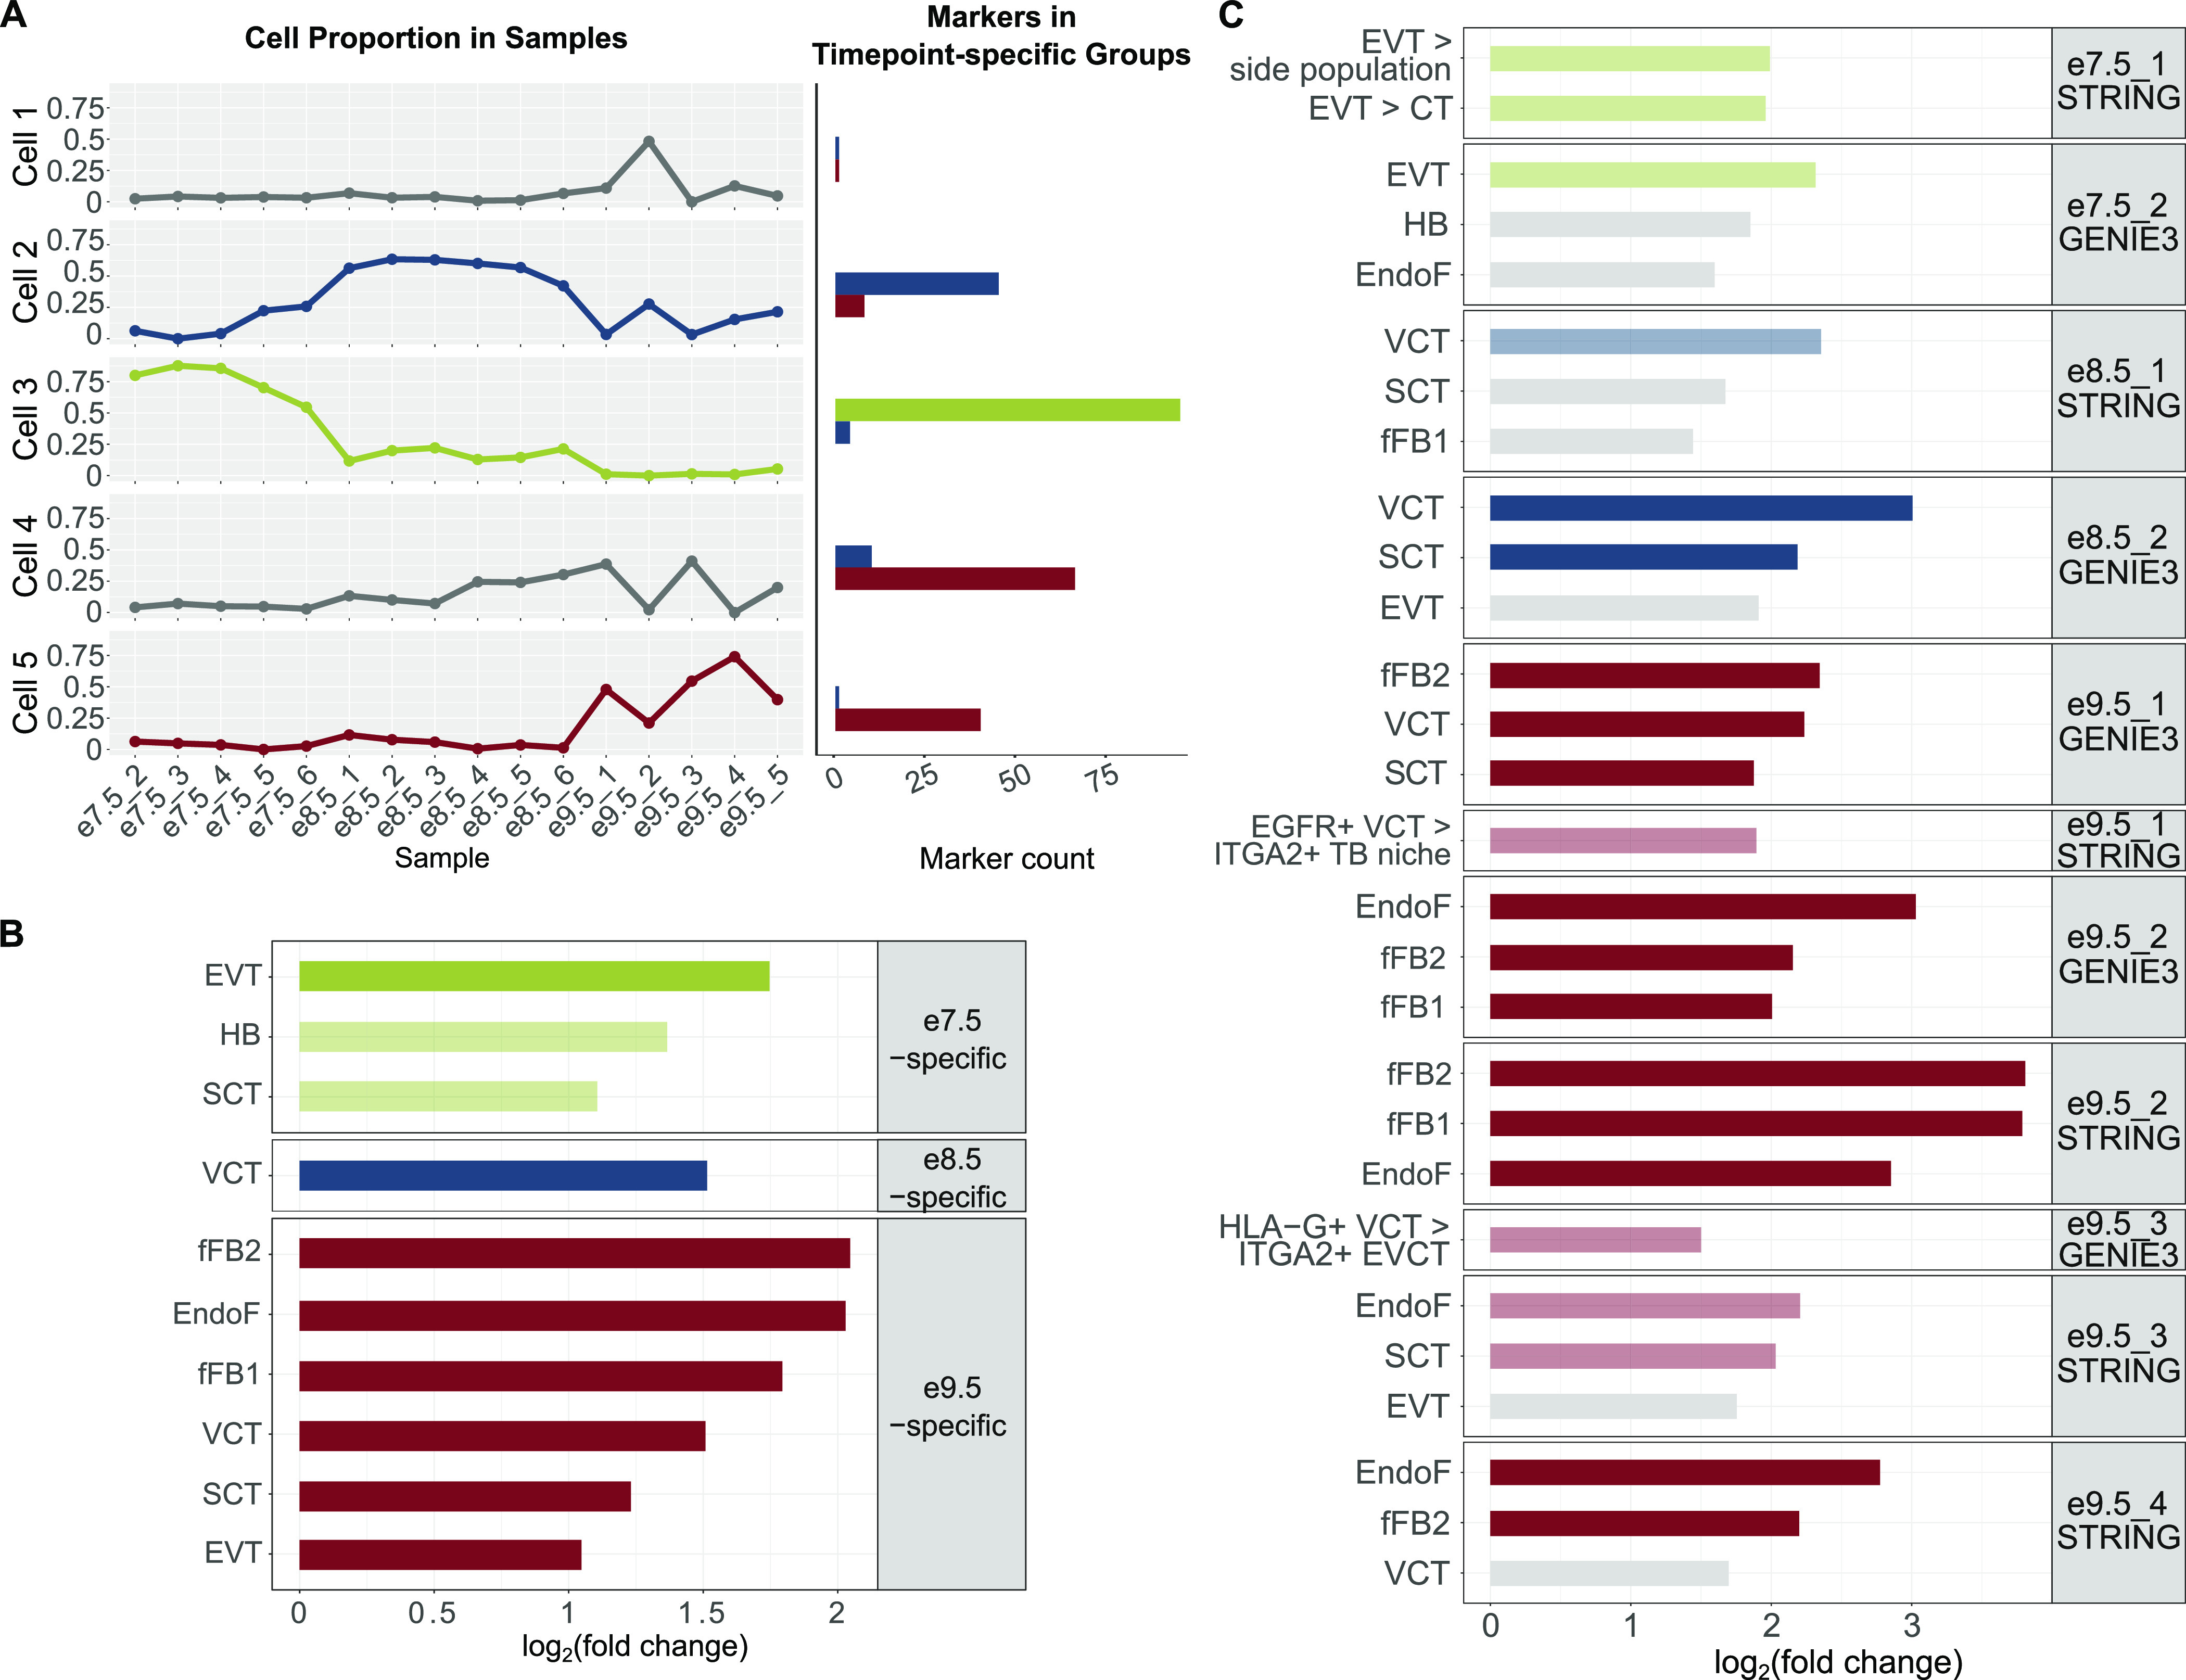
Figure 3. Timepoint-specific gene groups can be associated with human placenta cell–specific expression profiles.

(A) Deconvolution analysis using LinSeed showed five cell groups, three of which had highest proportions in e7.5 samples (group 3), e8.5 samples (group 2), and e9.5 samples (group 5). Also using LinSeed, we identified markers of each cell group and observed a high number of genes in common with timepoint-specific genes (cell group 3 with e7.5-specific genes, cell group 2 with e8.5-specific genes, and cell group 5 with e9.5-specific genes). Left panel: line charts showing cell proportions in each sample; right panel: bar plots showing the number of cell markers in each timepoint-specific gene group. (B) Bar plots showing that timepoint-specific genes share similar profiles to these of human placental cell populations. Enrichment analysis was carried out with PlacentaCellEnrich using first trimester human placenta single-cell RNA-seq data to determine gene groups with cell type–specific expression. A significant enrichment has adj. P-value ≤ 0.05, fold change ≥ 2, and the number of observed genes ≥ 5. The lightness of the colors corresponds to adj. P-value; the lighter colors, 0.005 < adj. P-value ≤ 0.05; and the darker colors, adj. P-value ≤ 0.005. Only enrichments for cells of fetal origin are shown. Full enrichment results (including both maternal and fetal cells) are shown in Fig S5. (C) Bar plots showing that network genes share similar profiles of specific human placental cell populations. (B) Enrichment analysis was carried out with PlacentaCellEnrich as in (B) and placenta ontology. Gray, adj. P-value > 0.05; the lighter colors, 0.005 < adj. P-value ≤ 0.05; and the darker colors, adj. P-value ≤ 0.005. For PlacentaCellEnrich, three fetal cell types with the lowest adj. P-values are shown. For placenta ontology, selected enrichments are shown. Full enrichment results (including both maternal and fetal cells and for every network) of PlacentaCellEnrich are shown in Fig S5. Full enrichment results (for every network) of placenta ontology are in Table S8. Abbreviations: SCT, syncytiotrophoblast; HB, Hofbauer cells; EVT, extravillous trophoblast; VCT, villous cytotrophoblast; EndoF, fetal endothelium; fFB1, fetal fibroblast cluster 1; fFB2, fetal fibroblast cluster 2; EVT > side population, GSE57834_extravillous_trophoblast_UP_side_population (genes up-regulated in EVT compared with side population—original data from GSE57834); EVT > CT, GSE57834_extravillous_trophoblast_UP_cytotrophoblast (genes up-regulated in EVT compared with cytotrophoblast—original data from GSE57834); EGFR+ VCT > ITGA2+ TB niche, GSE106852_EGFR+_UP_ITGA2+ (genes up-regulated in EGFR+ villous cytotrophoblast compared with ITGA2+ proliferative trophoblast niche—original data from GSE106852); and EGFR+ VCT > HLA-G+ EVCT, GSE80996_EGFR+_villous_cytotrophoblast_UP_HLA_G+_proximal_column_extravillous_cytotrophoblast (genes up-regulated in EGFR+ villous cytotrophoblast compared with HLA-G+ proximal column extravillous cytotrophoblast, original data from GSE80996).
