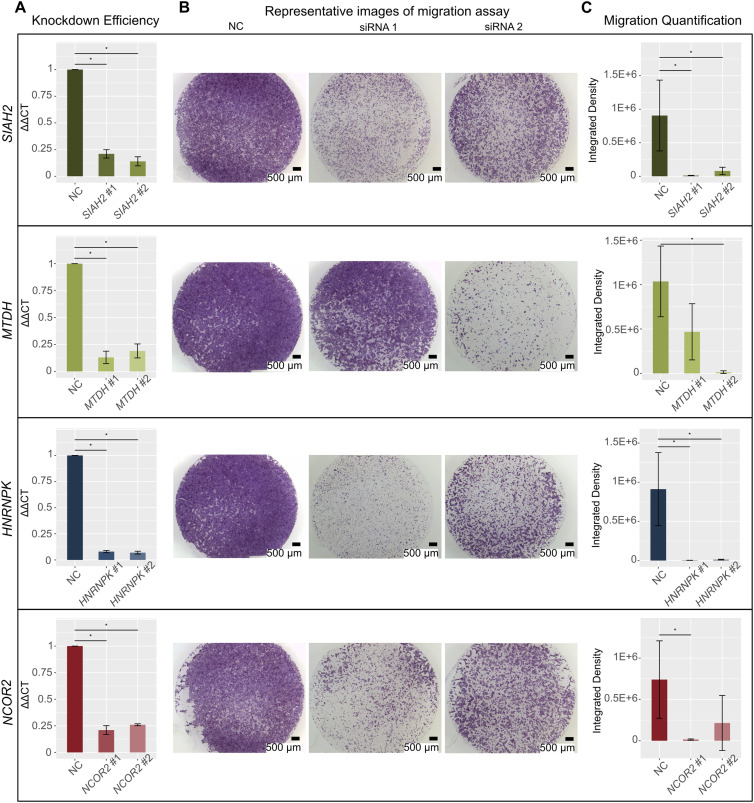
Figure 4. Gene knockdown (KD) of selected network genes showing reduction in cell migration capacity.
Panels correspond to four genes, SIAH2, MTDH, HNRNPK, and NCOR2. Each condition, negative control (NC), siRNA #1, and siRNA #2, had three biological replicates. Error bars show SD. (A) Bar plots showing that gene expression was significantly reduced after KD compared with NC. GAPDH was used for normalization of all four genes’ expression (∆CT). Percent KD was calculated with the ∆∆CT method. Values shown were normalized to the NC siRNAs. The y-axis shows ∆∆CT value. Details of KD efficiencies, siRNAs, and primer sequences can be found in Tables S10 and S11. (*) indicates P-value < 0.05 (one-sided Wilcoxon rank sum test, n = 3). (B) Representative images of migration assays. Left, NC samples; middle, siRNA #1 samples; right, siRNA #2 samples. Scale bar: 500 µm. (C) Bar plots showing significant reduction in the integrated density of cells after KD compared with NC samples. The y-axis shows integrated densities of cells in NC samples, samples KD with siRNA #1 of each gene, and samples KD with siRNA #2 of each gene. Details of integrated densities can be found in Table S10. (*) indicates P-value < 0.05 (one-sided Wilcoxon rank sum test, n = 3).

