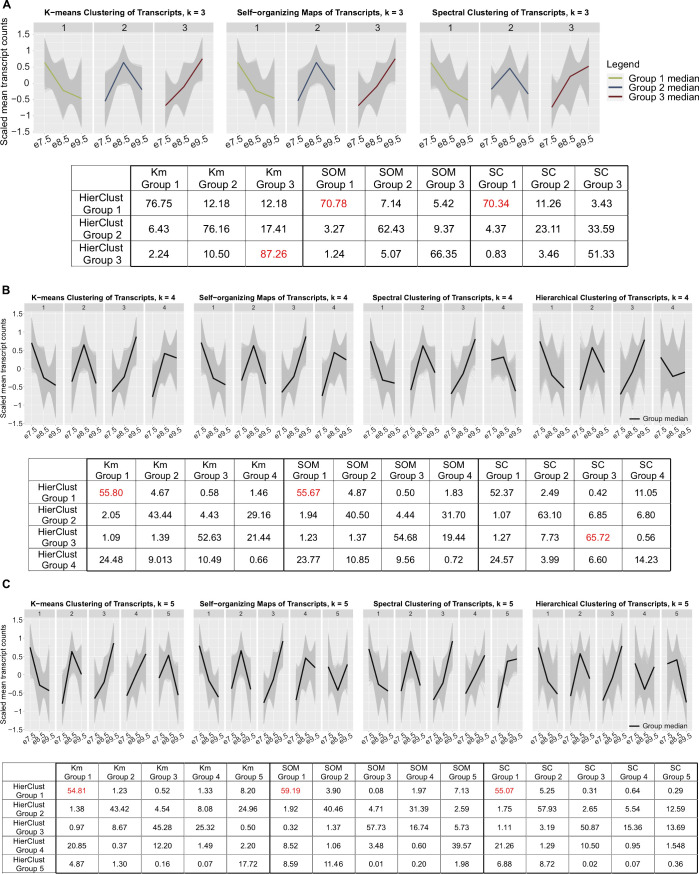
Figure S1. Cluster analysis using K-means clustering, self-organizing maps, and spectral clustering with different numbers of groups (k = 3, 4, and 5) showing hierarchical clustering with k = 3 is robust.
(A) Panel 1—line charts of scaled mean raw counts of transcripts in K-means clusters, self-organizing maps, and spectral clusters when k = 3, showing group median expression levels peak at each timepoint, agreeing with results from hierarchical clustering (Fig 1B). Green: median expression of transcripts in group 1; blue: median expression of transcripts in group 2; and dark red: median expression of transcripts in group 3. Panel 2—table with percent agreement across cluster assignments of each algorithm when k = 3, showing that groups, obtained using different clustering methods, with similar expression patterns to hierarchical clusters have high percent of agreement with hierarchical clusters. Maximum percent of agreement within one method is highlighted in red. (B, C) Panel 1—line charts of scaled mean raw counts of transcripts in K-means clusters, self-organizing maps, spectral clusters, and hierarchical clusters when k = 4 and 5. The charts show that group median expression levels do not have consistent patterns when using different algorithms. Black line: median expression of transcripts in groups. Panel 2—table with percent agreement across cluster assignments of each algorithm when k = 4 and 5, showing that percent of agreement among clustering algorithms decreased compared with that when k = 3. Maximum percent of agreement within one method is highlighted in red. Abbreviations: HierClust, hierarchical clustering; Km, K-means clustering; SOM, self-organizing maps; and SC, spectral clustering.

