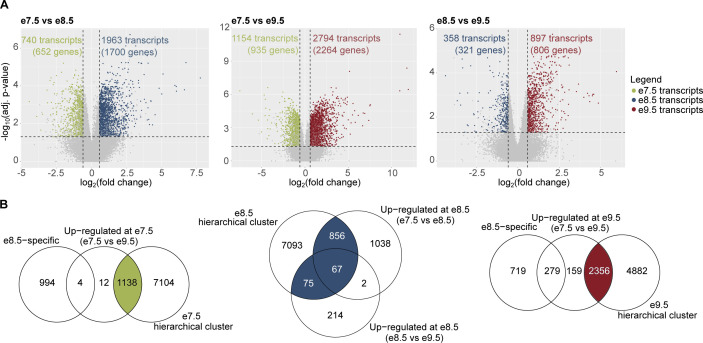
Figure S2. Identification of timepoint-specific genes using the combined results from hierarchical clustering and differential expression analyses.
(A) Volcano plots showing the number of differentially expressed transcripts in each analysis: e7.5 versus e8.5, e8.5 versus e9.5, and e7.5 versus e9.5. A transcript is differentially expressed if its q-value ≤ 0.05 and fold change ≥ 1.5. Green: transcripts up-regulated at e7.5; blue: transcripts up-regulated at e8.5; and dark red: transcripts up-regulated at e9.5. (B) Venn diagrams showing definitions of timepoint-specific transcripts (see the Materials and Methods section). There are 1,138 e7.5-specific transcripts (922 genes), 998 e8.5-specific transcripts (915 genes), and 2,156 e9.5-specific transcripts (1,952 genes). Green: e7.5-specific transcripts; blue: e8.5-specific transcripts; and dark red: e9.5-specific transcripts.

