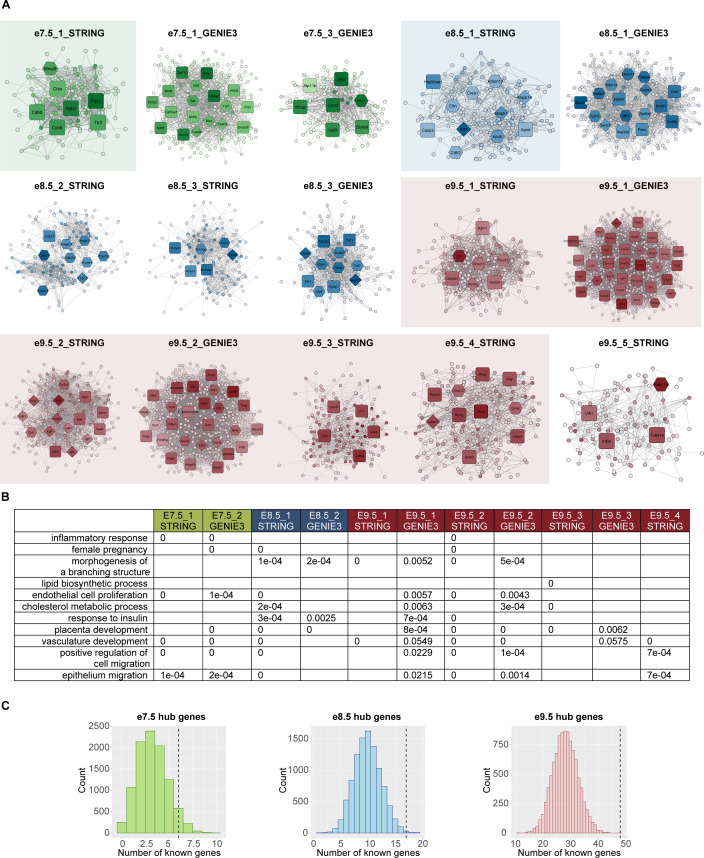
Figure S3. Network analysis identifies gene modules with placenta-specific functions.
(A) Visualization of network modules at all timepoints. Diamond shape, hub genes with known roles in placenta; hexagon, hub genes with possible roles in placenta; and rounded square, hubs without related annotation. Color: the darker the color is, the higher the node’s degree centrality is. For full scale of node degrees, see Table S4. The subnetworks highlighted with transparent-colored boxes were ones enriched for placenta-specific processes as shown in Fig 2A. (B) P-values of randomization tests for every term shown in Fig 2A. For each subnetwork, only terms that were originally enriched were tested. Details of randomization test procedures can be found in Materials and Methods, under the section “GO analyses.” (C) Bar plots showing the number of genes with known placental functions from random gene sets. Dashed lines are the observed numbers of known hub genes in each timepoint’s network. Details of randomization test procedures can be found in Materials and Methods, under the section “Network construction and analysis.”

