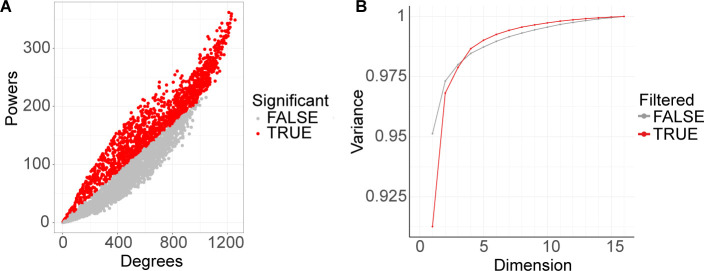
Figure S4. Deconvolution analysis results.
(A) 1,413 genes (colored red) were determined to be significant for deconvolution analysis. Starting with the top 5,000 most expressed genes across timepoints (expression in TPM), we used LinSeed to sample 100,000 times in order to determine the significant genes (P-value ≤ 0.05) for the gene linearity network topology. (B) Singular value decomposition plot showing the amount of variance the significant genes (red line) could capture with different numbers of dimensions (number of cell groups). Five cell groups, which captured 99% of the variance, were determined as present in the samples.

