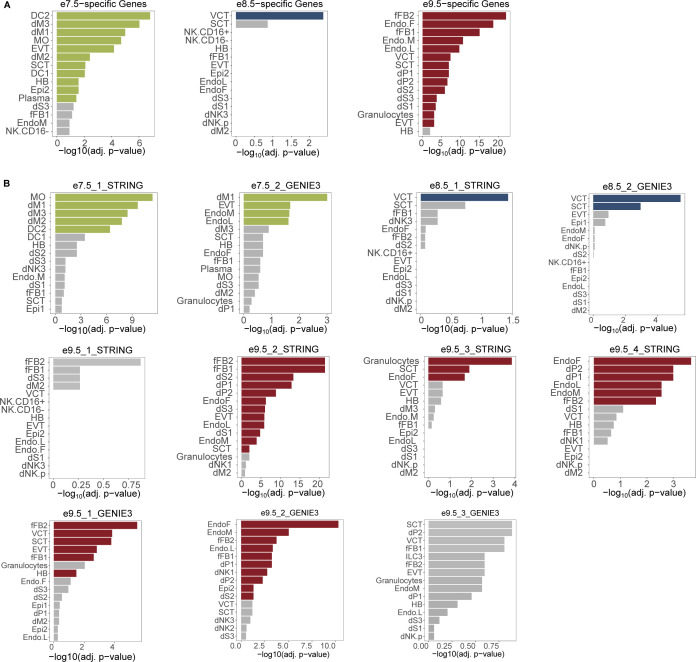
Figure S5. Full PlacentaCellEnrich results.
Colored bars: cell types with significant enrichments; gray bars: cell types with insignificant enrichments. The enrichment was significant if adj. P-value ≤ 0.05, fold change ≥ 2, and the number of observed genes ≥ 5. (A) Bar plots showing the cell type–specific enrichments of mouse timepoint-specific gene sets. (B) Bar plots showing the cell type–specific enrichments of subnetwork genes. Abbreviations: SCT, syncytiotrophoblast; HB, Hofbauer cells; EVT, extravillous trophoblast; VCT, villous cytotrophoblast; EndoF, fetal endothelium; fFB1, fetal fibroblast cluster 1; fFB2, fetal fibroblast cluster 2; DC, dendritic cells; dM, decidual macrophages; dS, decidual stromal cells; EndoL, lymphatic endothelium; Epi, epithelial glandular cells; and NK, natural killer cells.

