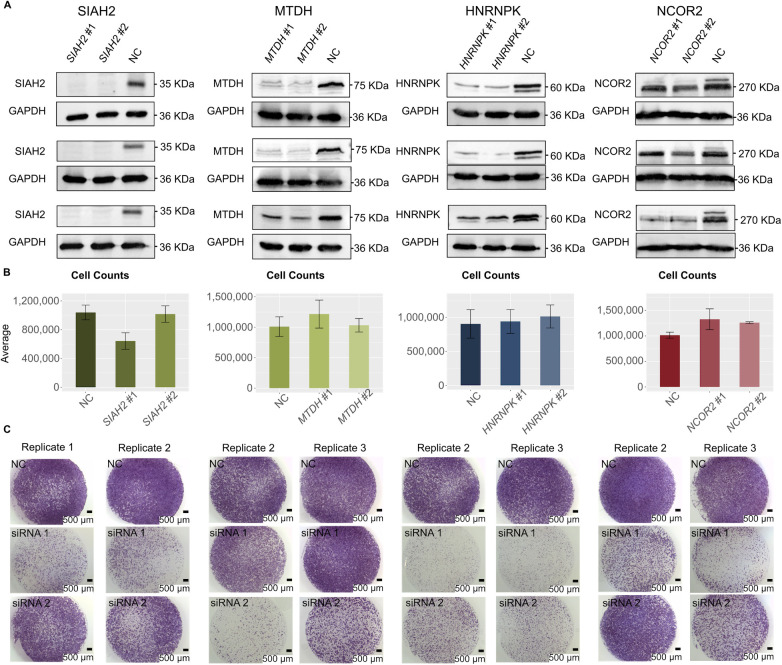
Figure S7. Gene knockdown of selected network genes showing reduction in cell migration capacity.
From left to right: SIAH2, MTDH, HNRNPK, and NCOR2 experiments. Each condition, negative control (NC), siRNA #1, and siRNA #2, had three biological replicates. (A) Images of Western blot experiments showing protein-level expression of each target gene was reduced after siRNA knockdown. For SIAH2 and MTDH, one isoform was detected in NC KD samples, and we observed reduced protein expression in target gene KD samples. For HNRNPK, two isoforms were detected in NC KD samples, and we observed reduced expression of both isoforms in target gene KD samples. For NCOR2, three isoforms were detected in NC KD samples, and only the siRNA-targeted isoform, a 274-kD protein (top band), is observed to have reduced protein expression in target gene KD samples. (B) Bar plots of cell counts before and after siRNA knockdown of each gene, showing that none of the siRNA knockdowns resulted in a significant change in cell counts (two-sided Wilcoxon rank sum test, n = 3). Error bars show SD. (C) Images of cell migration assays for all replicates that are not shown in Fig 4 (one-sided Wilcoxon rank sum test, n = 3). Scale bar: 500 µm.

