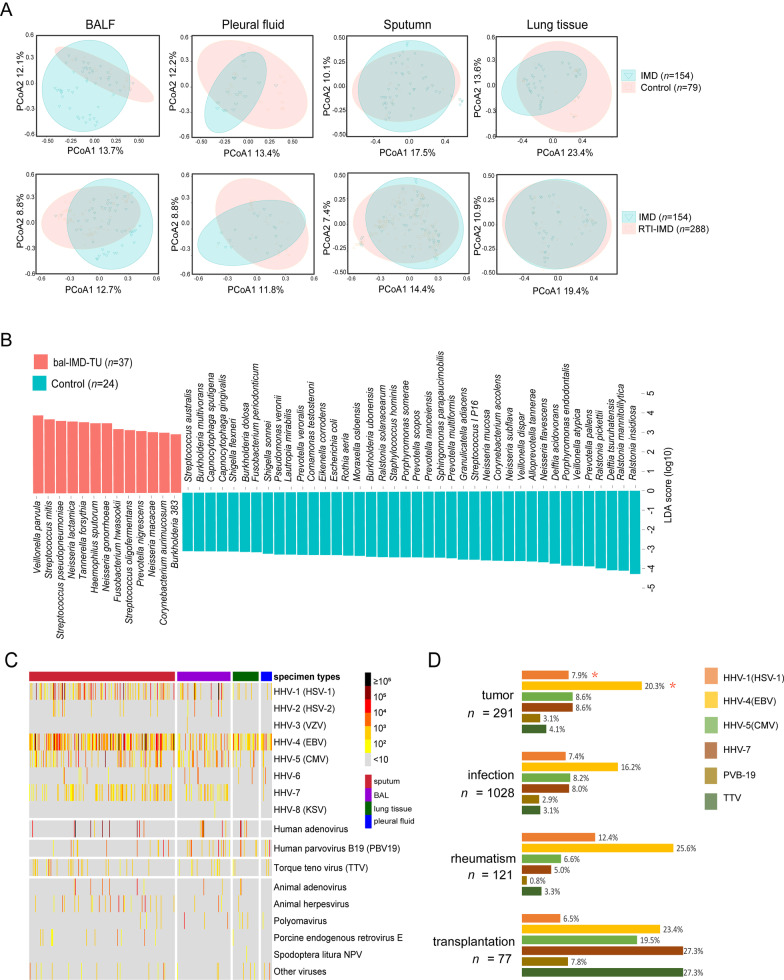
Fig. 5.
Bacteria and virus distribution between patient cohorts and specimens. a PCoA of microbiome in patients diagnosed with immune disorders (IMD, n = 154) versus the control patients (C, n = 79), and the IMD patients versus RTI-IMD patients (n = 288). b LEfSe analysis to rank the discriminating specimen-specific microbes in patients with tumors (bal-IMD-TU, n = 37), and the control group (C, n = 24) (LDA score > 3, P < 0.05). c Virus distribution and the corresponding RARs. d Top six virus species among four types of patient cohorts (n = 1182). The P values in the logic regression analysis were shown: *, P ≤ 0.05

