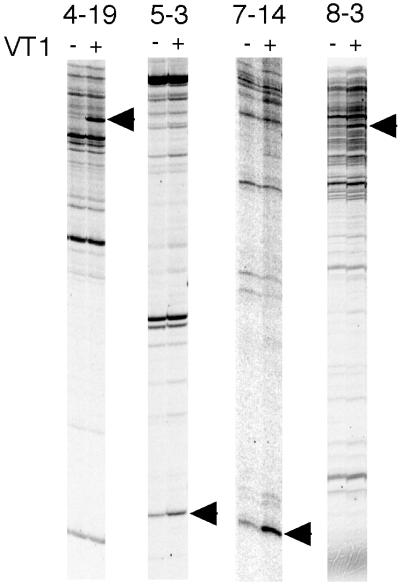
FIG. 1.
DD RT-PCR of Caco-2 cells. Caco-2 cells were treated with PBS (VT−) or 100 pM wtVT1 (VT+) for 6 h. The fluorescent DD RT-PCR products were analyzed on an FMBIO II Multi-View fluoroimage analyzer. Arrows show the differentially expressed bands. The numbers at the top show the primer sets (downstream primer-upstream primer) used in this experiment.

