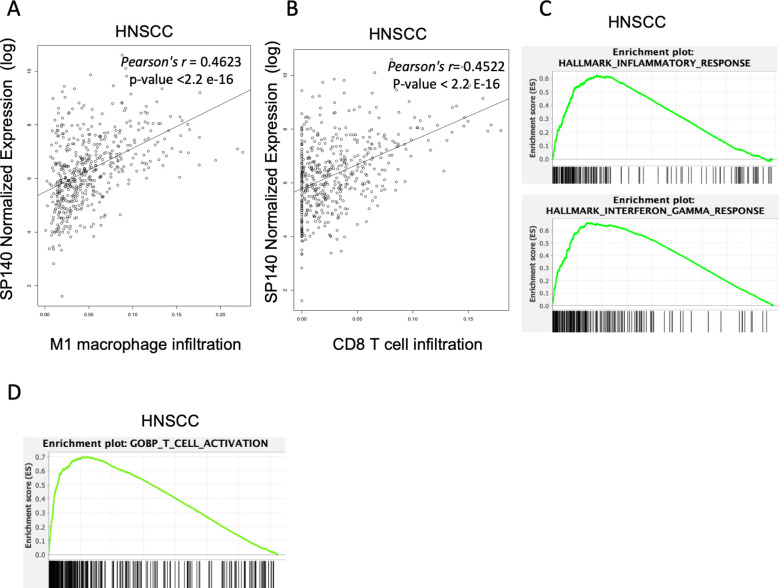
Figure 4.
(A, B) Correlation of SP140 expression with M1 macrophage and CD8 T-cell infiltration levels HNSCC (n=497). (C, D) Genes whose expression significantly correlated with SP140 expression were analyzed by GSEA in HNSCC samples (n = 522). The plot shows the top positively enriched pathways, hallmark inflammatory response, IFN-γ response, and T-cell activation. The Y-axis is the GSEA enrichment score. The X-axis is a list of genes ranked by differential expression correlation with SP140, with black bars representing genes in each gene set. GSEA, gene set enrichment analysis; HNSCC, head and neck squamous cell carcinoma; IFN-γ, interferon gamma; M1, proinflammatory phenotype; SP140, speckled protein 140.

