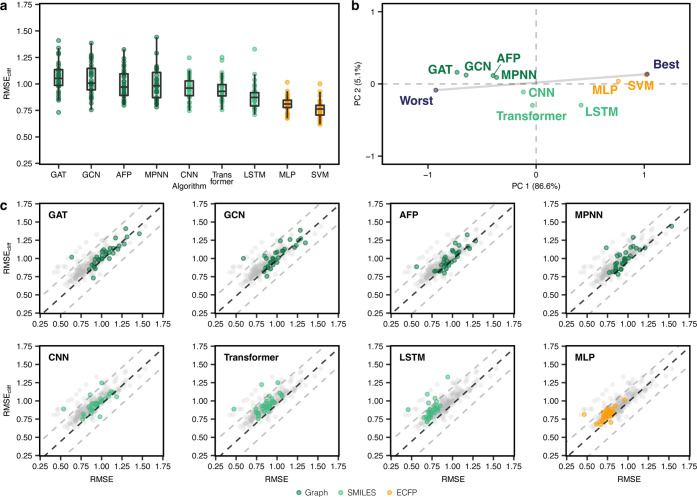
Figure 4.
Performance of deep learning methods. (a) RMSE on activity cliff compounds on different deep learning strategies. SVM is reported as a reference. (b) Global ranking of all methods using PCA (first two principal components, PC1 and PC2), scaled between best and worst performance. Every point captures the performance of a different machine learning approach obtained by considering the corresponding RMSEcliff on all data sets. “Worst” and “Best” indicated the worst and best performance obtained across all data sets, respectively. Percentages indicate the explained variance by each principal component. (c) Prediction error on activity cliff compounds (RMSEcliff) compared to all compounds (RMSE) for all methods.

