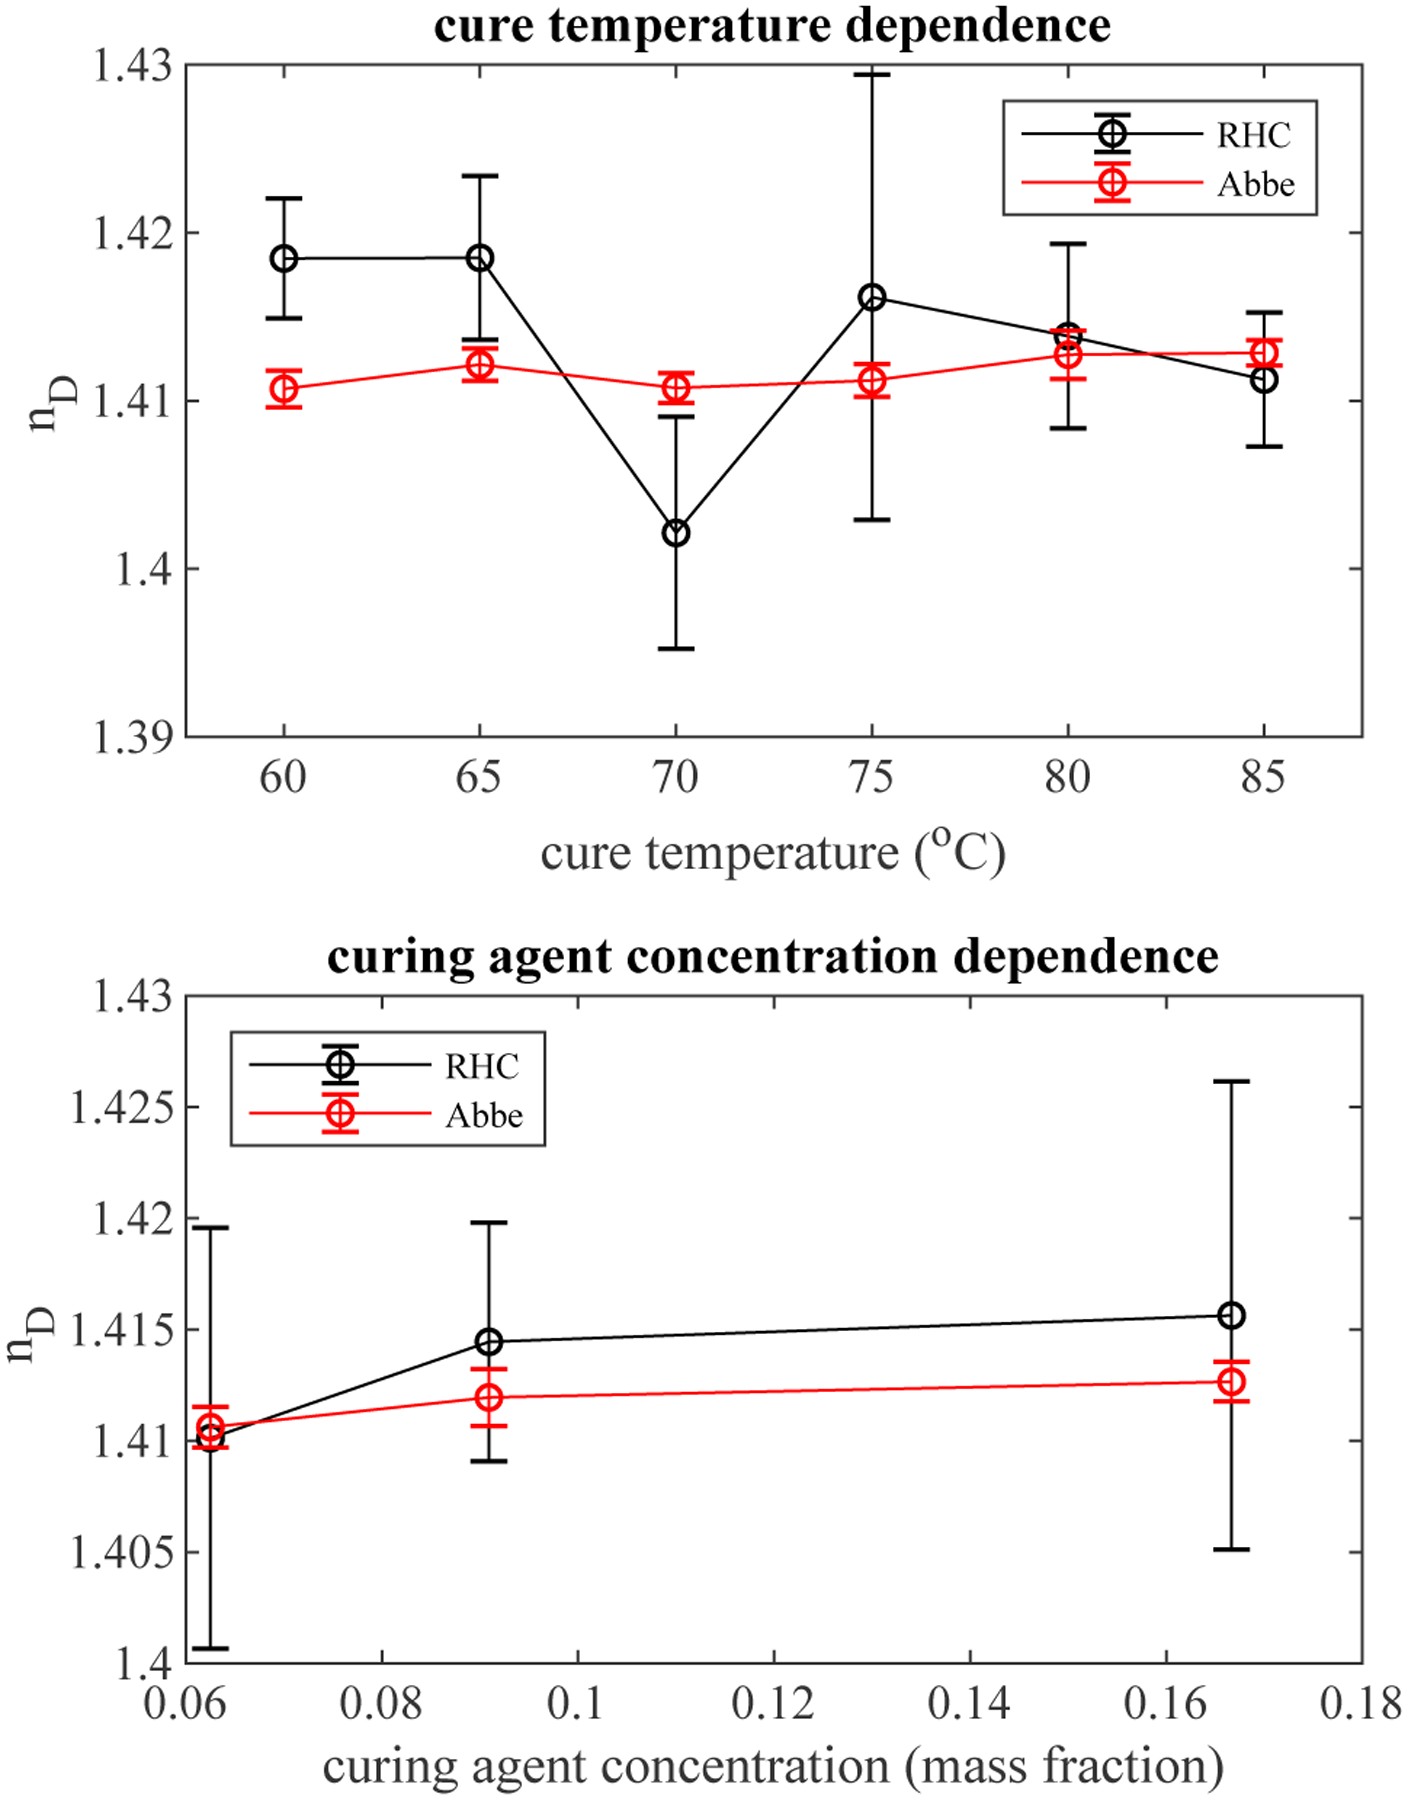
Fig. 3.

Refractive index of PDMS as a function of cure temperature (above) and curing agent concentration (below). Data points are a mean with error bars representing standard deviation. For cure temperature, 3 samples with 5 measurements each were pooled. For curing agent, 5 measurements of 6 samples made at each curing agent concentration were pooled.
