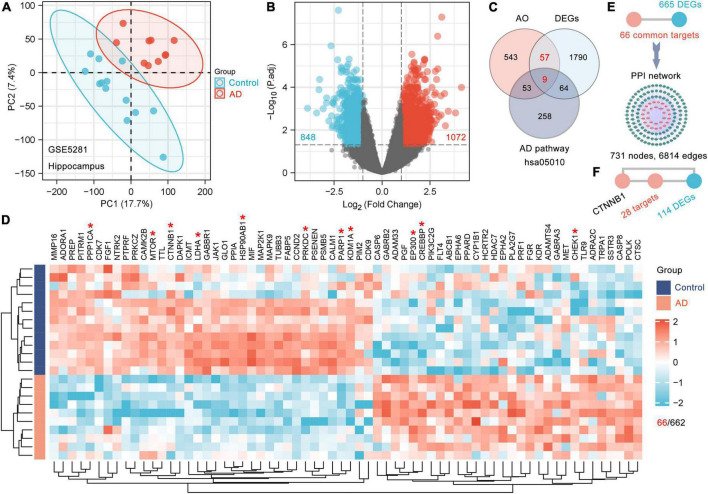
FIGURE 2.
The gene basis for the cognitive impairment in kidney deficiency. (A) PCA displays sample clustering within age-matched control (n = 13) and AD hippocampal brain samples (n = 10). (B) Volcano plot of DEGs between the AD and control brain. The threshold parameters used were | Log2 (fold change)| > 1 and p adjust < 0.05. (C) Venn diagram showing the shared genes among AO targets, DEGs and AD pathway (hsa05010). (D) Clustering heatmap of 66 AO targets differentially expressed in AD hippocampus. Red and green represent high and low expressed genes, respectively. The Top 10 AO-regulated DEGs ranked by degree with an asterisk in the heatmap were marked red (D). (E) 665 DEGs directly interact with 66 AO-regulated DEGs as shown in the PPI network. (F) CTNNB1 (β-catenin) directly interacts with 28 AO-regulated DEGs.

