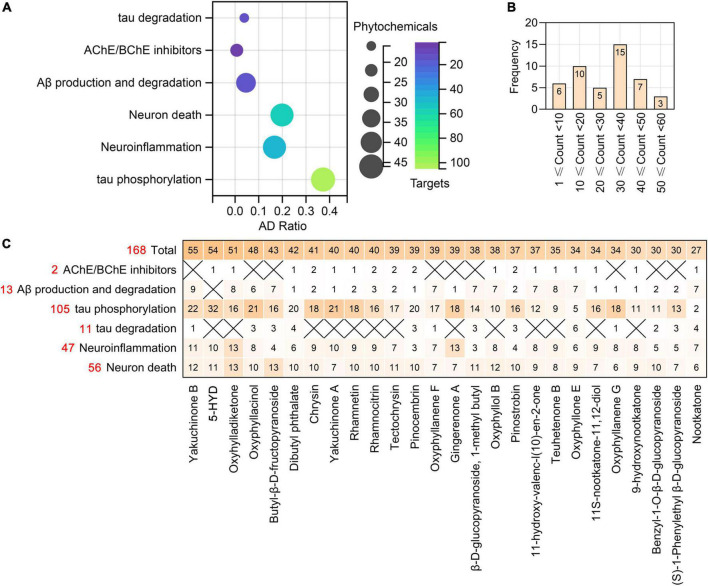
FIGURE 9.
The phytochemicals and targets of AO in treating neurodegenerative dementia. (A) Bubble plot showing the number of phytochemicals of AO targeting tau degradation, ACHE/BCHE, Aβ production and degradation, tau phosphorylation, neuroinflammation, and neuron death. The x-axis, AD Ratio (the ratio of the targets in the total targets). Bubble size, the number of AO phytochemicals. Bubble color, the number of targets. (B) Frequency distribution of AO phytochemicals with different numbers of anti-AD targets. (C) Heatmap summarizes the number of targets for AO phytochemicals regulating different pathological processes. X indicates not applicable. The red numbers represent the total number of targets involved in each row in the heatmap.

