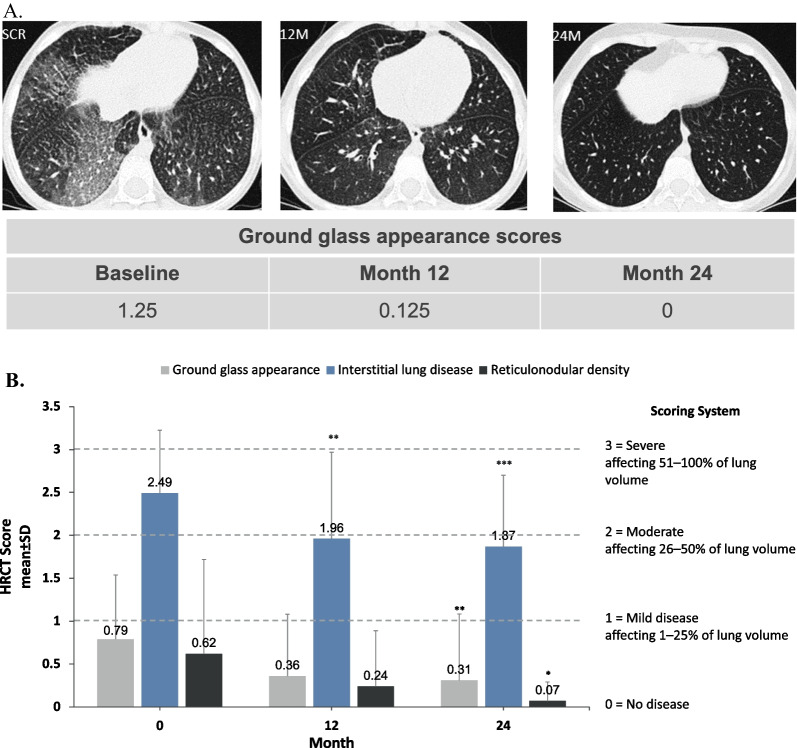
Fig. 4.
Changes in interstitial lung disease parameters over time with olipudase alfa treatment. A High-resolution computed tomography (HRCT) lung images of lower lung zones for a patient in the child group at baseline, 12 months, and 24 months. Scoring of images for ground glass appearance shown in the table below the images is based on a 4-point scale (0 = no disease; 1 = mild [1–25% lung volume affected]; 2 = moderate [26–50%]; 3 = severe [51–100%]). B Bar graph shows mean scores for ground glass appearance, interstitial lung disease, and reticulonodular density determined from HRCT images based on the percent of lung volume affected averaged over all four lung levels and both lungs. Images were scored based on the 4-point scale shown. Level of significance at each timepoint is indicated in the figure with asterisks (*p < 0.05; **p < 0.01; ***p < 0.001). Mean change from baseline to month 24 and P values are provided in the results section

