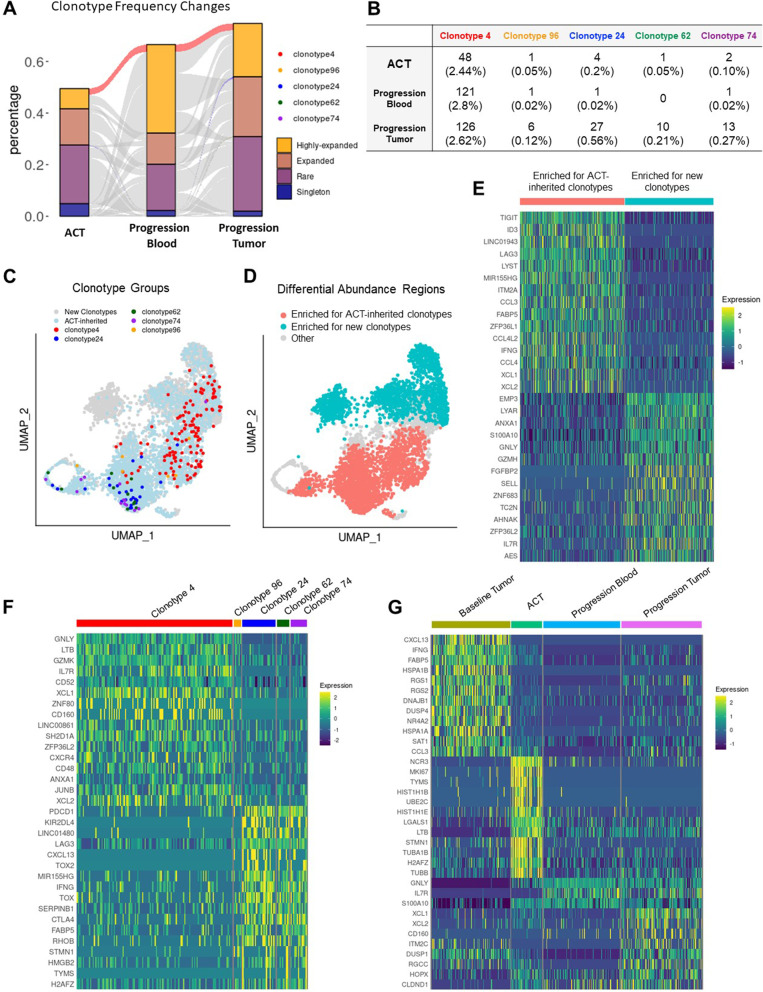
Fig. 2.
ACT-derived T cells infiltrate a recurring tumor but become exhausted. A Alluvial plot displaying the frequency in the ACT blood, tumor at progression and blood at progression of all clonal groups found in at least two of the three samples. Previously defined clonal groups that were preserved or contracted during the ACT culture are highlighted. For ease of comparison, supplemental Fig. 1 includes the same panel without the middle column. B Table listing the absolute number of cells with the indicated clonotype, and the percentage of the repertoire occupied by each clonal group (in parentheses). C Scatter plot of UMAP embeddings of TILs at progression, colored by expression of the indicated clonotypes. D Scatter plot of UMAP embeddings of TILs at progression, showing regions with differential abundance detected between ACT-inherited clonotypes and new clonotypes. E Heatmap of differentially expressed genes between cells belonging to the indicated differential abundance areas. F Heatmap of differentially expressed genes between cells belonging to the indicated clonotypes in the tumor at progression. G Heatmap of differentially expressed genes between cells belonging to clonotype 4 harvested at the indicated time points. For all heatmaps, rows represent genes ordered by fold changes. Columns represent individual cells grouped by identity class as indicated on the horizontal bars. Values are scaled and mean-centered log2-transformed gene counts

