Fig. 4.
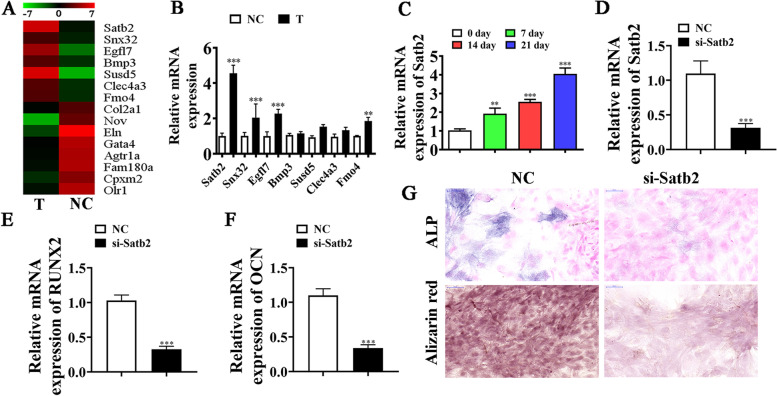
Satb2 plays a role in osteogenic differentiation of BMSCs. A NGS was applied for mRNA expression detection in BMSCs after osteogenic induction for 0 (NC) and 3 (T) weeks. B RT-qPCR results showing abnormal mRNA expression. Data are denoted as the mean ± SD. **P < 0.01, ***P < 0.001 vs. NC. C RT-qPCR detection giving Satb2 expression during BMSC osteogenic differentiation. Data are denoted as the mean ± SD. **P < 0.01, ***P < 0.001 vs. 0 day. D RT-qPCR detection giving Satb2 expression in BMSCs after siRNA transfection against Satb2 (si-Satb2) or negative control (NC). Data are expressed as the mean ± SD. E, F RT-qPCR data giving RUXN2 and OCN expression after osteogenic induction for 3 weeks. Outputs are expressed as the mean ± SD. G Immunohistochemical staining for ALP and alizarin red staining showing BMSC osteogenic differentiation ability post silencing Satb2. ***P < 0.001 vs. NC

