Fig. 1.
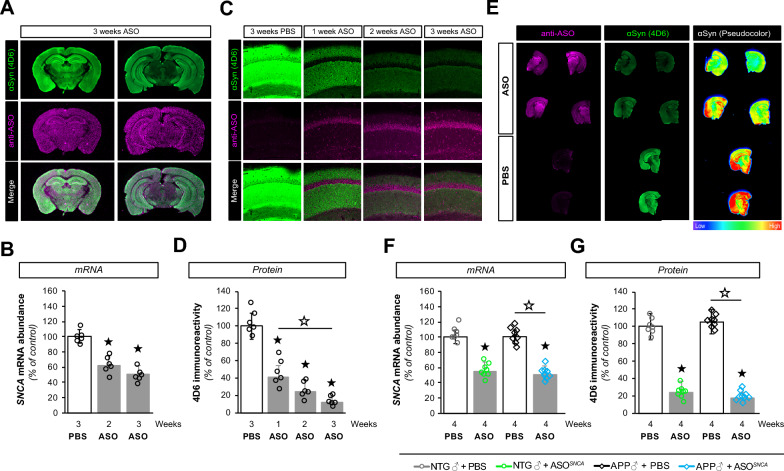
ASO1 disperses throughout the brain and lowers SNCA gene expression. A Infra-red imaging documenting the widespread distribution of ASOs 3 weeks after injection using anti- ASO (pink) and anti-αSyn (4D6, green) antibodies. B Reduction in SNCA mRNA at 2 and 3 weeks post-injection as determined by RT-qPCR. C Confocal imaging illustrating the presence of ASO1 (pink) and a corresponding decrease in αSyn (green) in mouse hippocampi. D Quantification of hippocampal 4D6 immunoreactivity in ASO1 or PBS treated mice. E Infra-red imaging detected αSyn (green) and ASO (pink) in coronal brain sections from PBS and ASO treated mice. The relative αSyn signal was lower in ASO-injected animals than in PBS-injected animals (pseudocolor). F, G Measurements of SNCA mRNA abundance by RT-qPCR (F) and αSyn protein amounts by immunofluorescence (G) in transgenic (APP) and non-transgenic (NTG) animals treated with PBS or ASO. Histogram bars represent mean ± SEM, ★P < 0.05 compared to NTG + PBS, ☆P < 0.05 compared to APP + PBS

