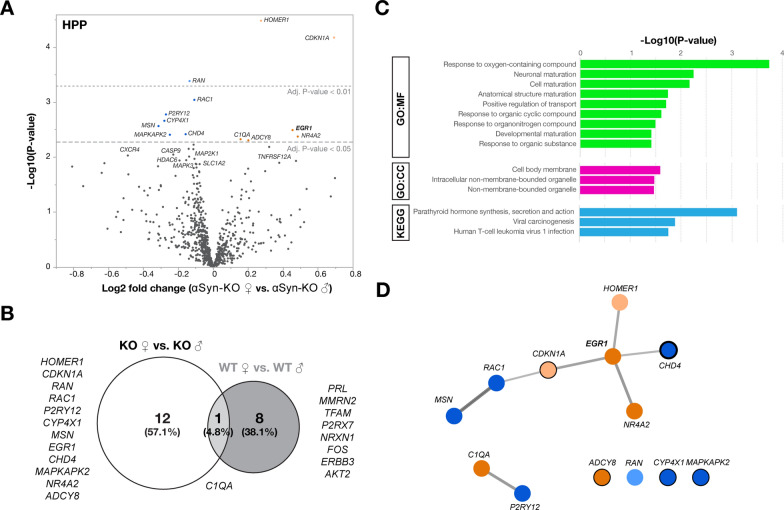
Fig. 6.
Differential gene expression in male and female αSyn-KO mice. NanoString® transcriptional profiling was performed on hippocampal RNA from 6-month-old female and male αSyn-KO mice. A Volcano plot of the differentially expressed genes of αSyn-KO females compared to αSyn-KO males at adjusted significance thresholds of P < 0.05 and P < 0.01. Orange indicates upregulated genes, blue indicates downregulated genes. B Venn diagram of differentially expressed genes shows little overlap between WT and αSyn-KO females and males. C Top results for GO and KEGG databases using the female and male αSyn-KO differentially expressed gene list performed with g:Profiler for functional enrichment analysis. D MCL clustering and visualization of Cytoscape clusters was performed using clusterMaker2 based on co-expression data. Analysis revealed EGR1 as a central node in the network as well as several EGR1 target genes (black circles, thickness reflects the number of responsive elements)

